Using VisualVM to Monitor Slow Execution of Services
Use VisualVM to analyze threads that are in runnable state. The threads are visually indicated as a green line. If you see a line that remains green for an extended period of time, and this line is not one of the default JVM threads, then it is recommended to drill-down and analyze the transactions.
VisualVM does not record data over time. The performance issues should be analyzed and identified as they occur.
In the Threads tab, click Threads Dump to capture several thread dumps over time. This enables you to analyze the data offline.
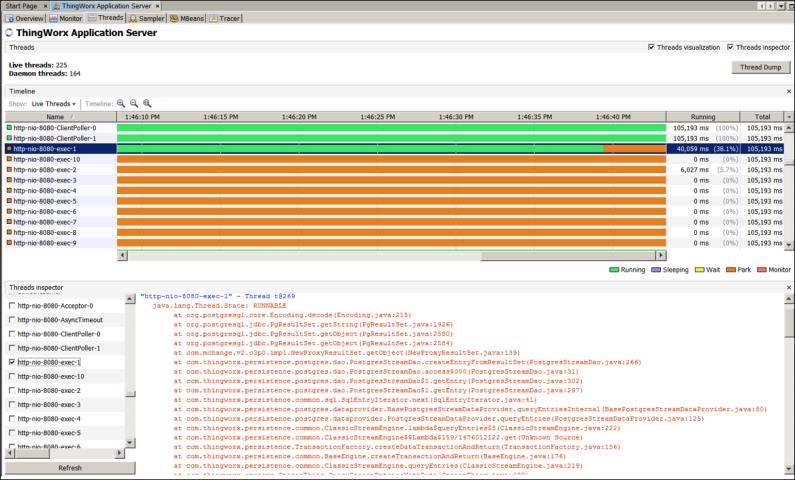
In the example, the http-nio-8080-exec-1 thread is active for an extended period. The corresponding call stack for the thread shows that the thread is executing a large query on the database to retrieve stream data. In this case, identify the service running on this thread and optimize it.