Analyzing the Log Files of Garbage Collector (GC) to Monitor Memory Issues
It is recommended that you enable GC logging in production environments. See the section Monitor the Memory Usage of a ThingWorx Server, for more information on how to enable GC logging. After GC logging is enabled, all the GC activity on the server is logged. If the JVM is unresponsive for long periods of time, external tools, such as VisualVM, may not be able to collect memory data. However, JVM can print the GC activity, which helps you identify the cause for the memory issue.
Reading the GC Logs
You can use tools such as GCEasy.io and Chewiebug GC Viewer, to analyze GC logs. You can also analyze GC logs manually in a text editor for common issues.
Each memory cleanup operation is generally printed, as shown in the following example.
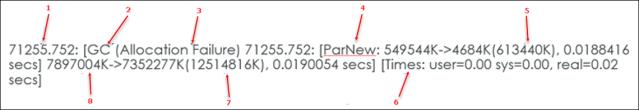
1. Time since JVM start
2. Type of GC
3. Reason for GC
4. Young Generation cleaned up from 549M to 4M
5. Total Young Generation size
6. Overall time for GC to complete
7. Heap allocated
8. Total memory of the solution that Java is cleaning
See Oracle documentation for more information on GC operations.
A GC analysis tool converts the text representation of the cleanups into a more easily readable graph.

Analyzing the data in the GC log helps you identify the following scenarios that indicate memory issues in your ThingWorx solution:
• Extremely long full GC operations (45 seconds+)—These are stop-the-world operations, which are highly undesirable. For example, the following full GC takes 46 seconds. During this time, all other user activity is stopped:
272646.952: [Full GC: 7683158K->4864182K(8482304K) 46.204661 secs]
• Full GCs occurring in a loop—These are full GCs occurring in a quick succession.
For example, the following four consecutive garbage collections take nearly two minutes to resolve:
16121.092: [Full GC: 7341688K->4367406K(8482304K), 38.774491 secs]
16160.11: [Full GC: 4399944K->4350426K(8482304K), 24.273553 secs]
16184.461: [Full GC: 4350427K->4350426K(8482304K), 23.465647 secs]
16207.996: [Full GC: 4350431K->4350427K(8482304K), 21.933158 secs]
16160.11: [Full GC: 4399944K->4350426K(8482304K), 24.273553 secs]
16184.461: [Full GC: 4350427K->4350426K(8482304K), 23.465647 secs]
16207.996: [Full GC: 4350431K->4350427K(8482304K), 21.933158 secs]
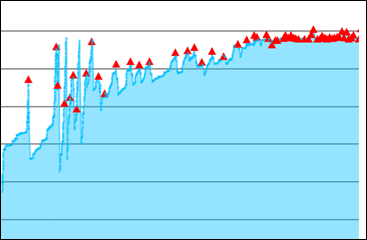
• In the following graph, the red triangles on the graph spikes are visual indications that full GCs are occurring in a loop:
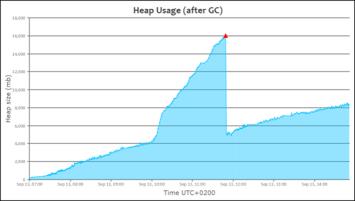
• Memory leaks—These occur when an increasing number of objects are retained in memory, and the memory cannot be cleaned.
In the following example, the memory is increasing steadily despite the garbage collectors:
Recommendation—If there is no automated tool to monitor and record memory usage over time, then check the GC log files daily for memory issues. When memory issues occur, collect JVM thread dumps or heap dumps to identify long-running operations. These operations can trigger the underlying memory issues in your ThingWorx solution.