Schedule Optimization Reports
Schedule Optimization reports provide you with performance indicators for measuring the efficiency of Schedule Optimization jobs. You can use the reports to view key performance indicator values such as technician utilization, drive time, and SLA violations.
Overall scheduling effectiveness can be determined using the reports on each of the generated metrics. This provides a comprehensive visual view of Technician Utilization, Drive Time, SLA Violations, and Skills Violations for a given Schedule Optimization job and a Dispatch Process.
Unlike Service Performance Metrics, metrics related to Schedule Optimization are not generated for work that has been completed. Instead, they are forward-looking, which means that the metrics are focused on work planned for the future.
The business data required to generate these metrics are created to complete the Schedule Optimization dispatch process job runs.
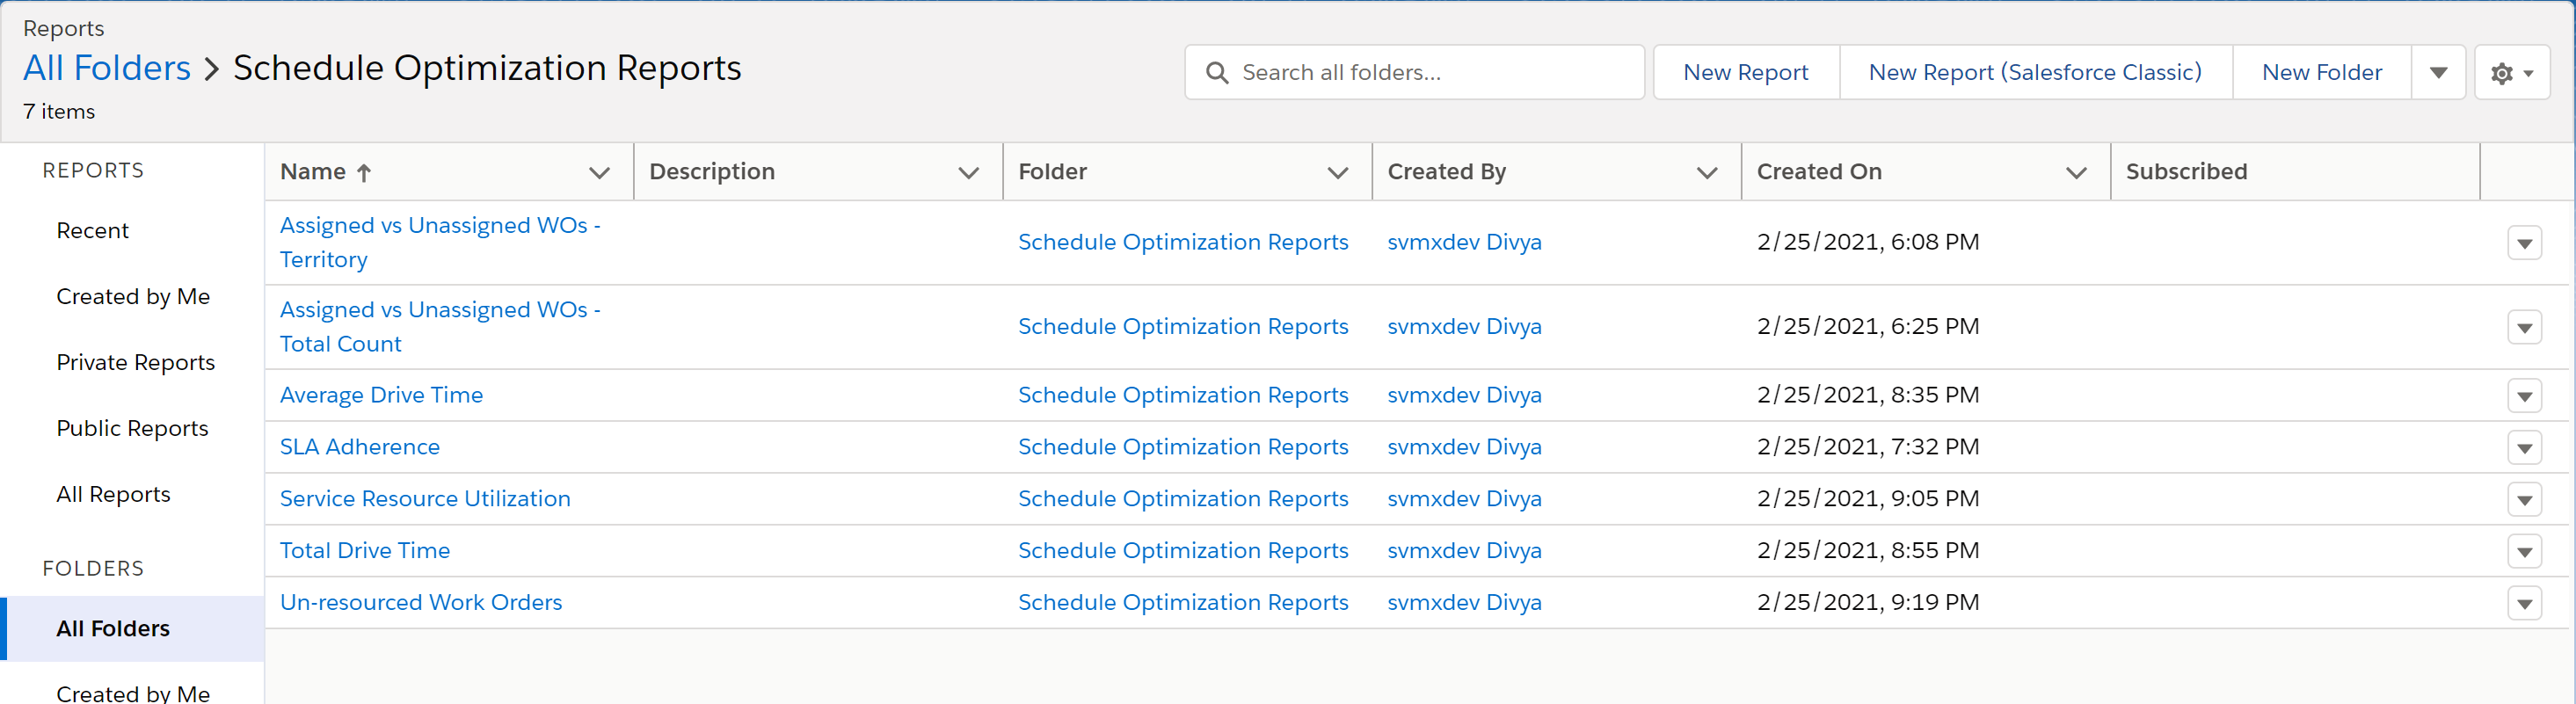
The following graphs are available in the dashboard:
• Assigned vs. Unassigned WOs - Territory
• Assigned vs. Unassigned WOs - Total Count
• Average Drive Time
• SLA Adherence
• Service Resource Utilization
• Total Drive Time
• Un-resourced Work Orders
To view Schedule Optimization reports, navigate to Reports in the ServiceMax home page and then select Schedule Optimization Reports on the Reports home page.
The following screen displays the Schedule Optimization reports page. The reports page displays the available Schedule Optimization reports in the tabular format.
To view a report, click the report name in the table. The report is displayed in a new tab.
Actions Performed
In the Schedule Optimization Reports page, you can perform some actions on the report rows. To see the available options, click the drop-down icon next to each row.
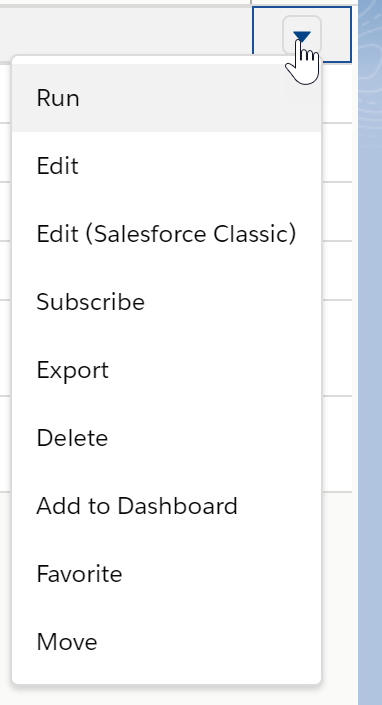
You can perform the following actions on individual report pages:
• Toggle chart: Click the Toggle Chart icon to toggle between the graph and the tabular data.
• Filter the data in the report: Click the Filter icon to filter the data in the report. You can filter the report data by the specified fields for each report.
• Refresh report: Click the Refresh icon to refresh the report data.
• Edit report: Click Edit to edit the report. This gives you an option to customize the report as per your requirement.
• Save the report: Click the drop-down icon and select Save or Save As to save the report.
• Subscribe to the report: Click the drop-down icon and click Subscribe to the report.
• Export the report: Click the drop-down icon and click Export to save the report in the specified format and export it.
• Delete the report: Click the drop-down icon and click Delete to delete the report.
• Add report to a dashboard: Click the drop-down icon and click Add to Dashboard to add the report to an existing dashboard.