View Attribute History by Time of Occurence
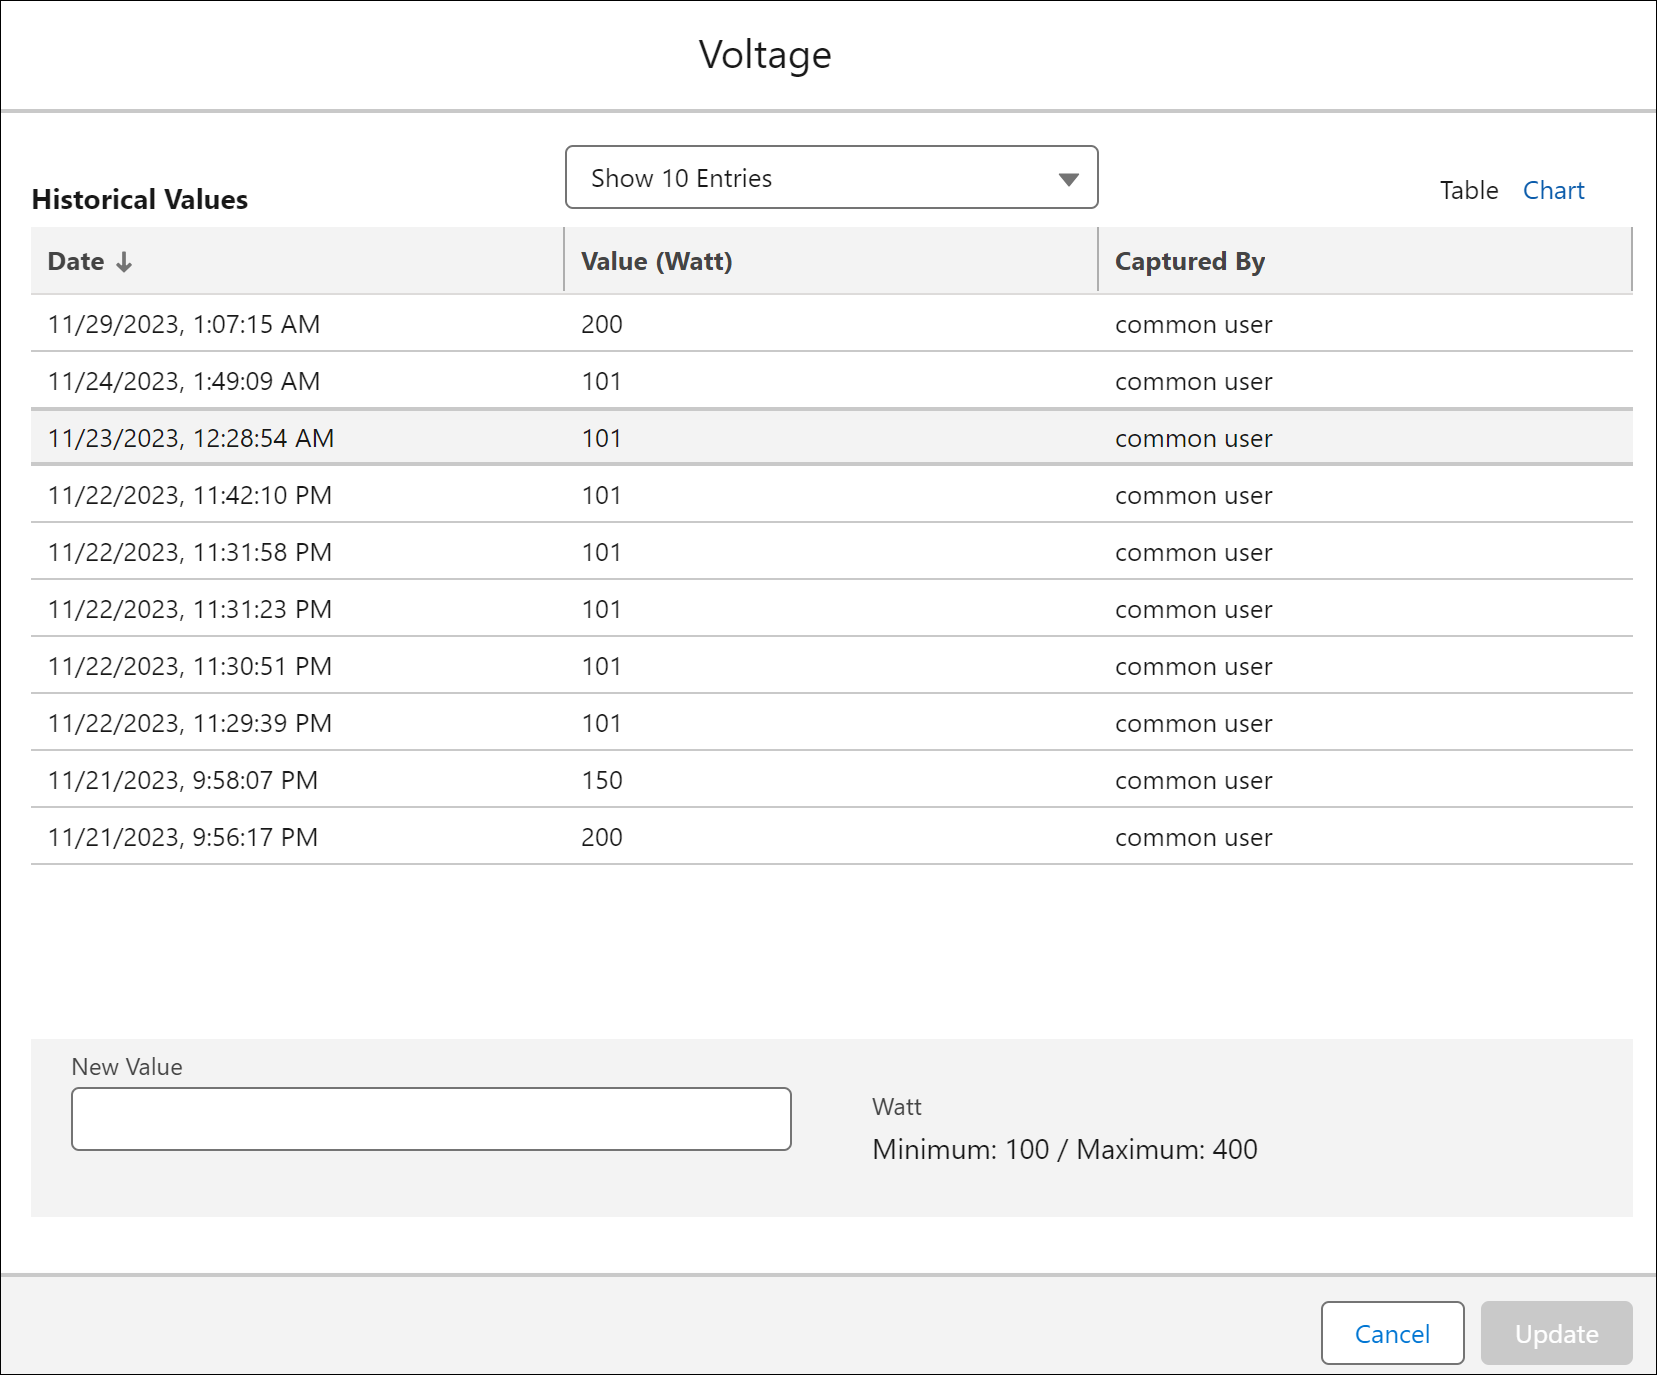
You can analyze the history of a specific attribute to understand the change in pattern when viewing IB's latest attribute value from the Technical Attribute UI. Using the Technical Attribute UI, you can capture the latest value, see if any threshold is configured, view attribute change history in tabular format, and view the attribute change trend in chart view for numeric values only. From the Technical Attribute widget, click on any Technical Attribute name to display the attribute history for that specific attribute, as shown in the following screen.

The following table explains each UI detail displayed on the Attribute History page.
Field | Description | ||
|---|---|---|---|
Show Entries | Select the number of entries displayed from the picklist: 10, 20, 30, or 50. | ||
Date | Displays the timestamp when the attribute displayed a specific value in the format yyyy:mm:dd hh:mm:ss. | ||
Value | Displays the value set for the attribute. | ||
Captured By | Displays the user's name who captured the attribute information. | ||
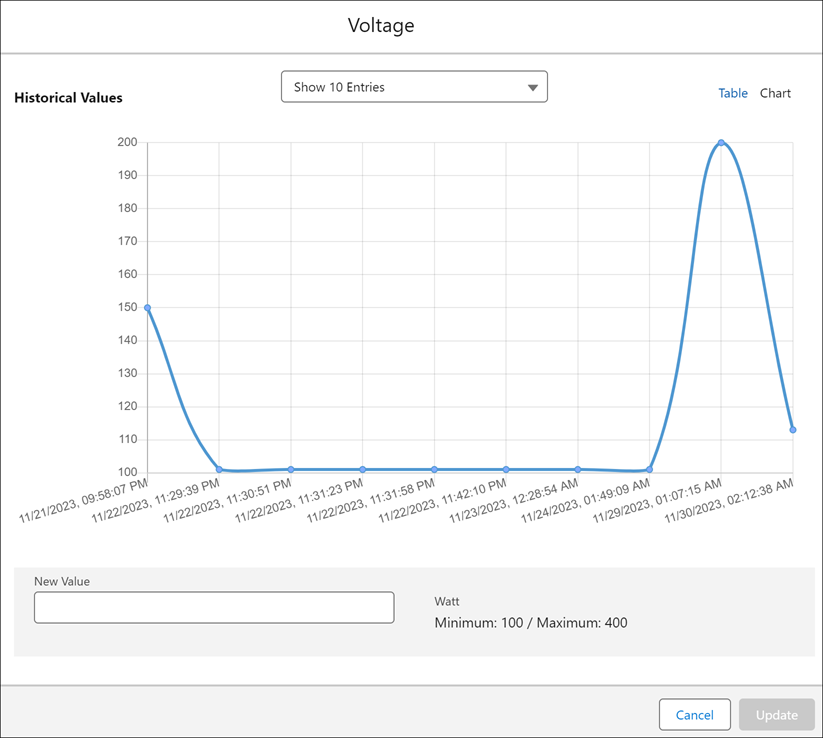
Chart | Click the Chart option to view the historical data in a chart view.
| ||
New Value | Enter the new value for the attribute and click Update. This also updates the value of the technical attribute on the main component. |
The following screen displays the Chart option to display the historical data for numeric attributes only:
