Monitor Job Execution Status
You can monitor the execution status of jobs you schedule for each metric in the Status tab of the SPM Setup screen.
Whenever you click the Status tab, the latest results are fetched and displayed. You can view the log of execution of the job also from this tab. This section describes in detail the Status screen and the actions you can take. The screenshot below shows the Status tab for Attach Rate metric:
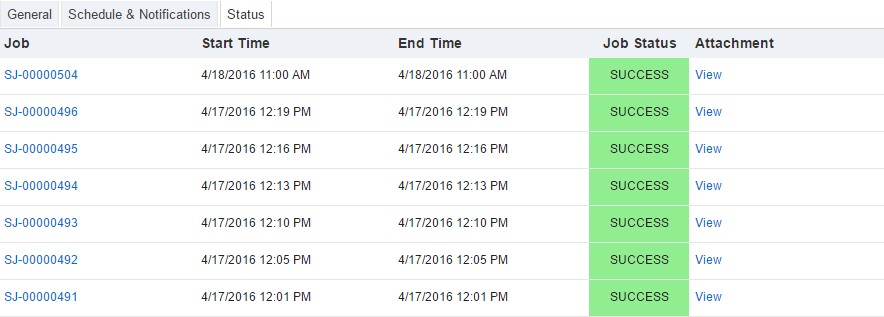
The job execution details are displayed in reverse chronological order, with a maximum of 30 records. The following details are displayed:
• Job: Displays the hyperlink to the ServiceMax Job record which stores the details of job execution, including the log file as an attachment.
• SPM Report: Displays the metric name.
• Start Time: Displays the scheduled job execution start time.
• End Time: Displays the scheduled job execution end time.
• Job Status: Displays SUCCESS or FAILURE, with color-coding.
• Attachment: Displays the hyperlink to view the scheduled job execution log file. The log file records the number and details of the records processed, the number of batches in which the records were processed, and the duration & status of job execution.
ServiceMax supports log files both in the attachment as well as Salesforce File format. In the Attachment column, click View to view the log file. If you selected Attachment, then, you can view the log file on a separate tab. If you selected Salesforce File (If GBL037 is true), the file gets downloaded to your system.