SPM Configuration for Administrators
Service Performance Metrics (SPM) refer to key performance indicators in a field service organization. These need to be regularly monitored to evaluate the organization’s service delivery, measure the effectiveness of service operations, and identify areas of improvement to boost productivity and profitability. In ServiceMax, the top service performance metrics which can be measured on your business data are the ones that are most impactful to the organization. These are listed below:
• First-Time Fix: How often do your technicians resolve customers’ problems on the initial visit itself?
• Mean Time To Repair: What is the average time required to deliver a break-fix?
• Contract Up Time: What is the uptime % of installed products covered by a contract?
• Attach Rate: How many of your contacts/customers are buying service contracts, and how many installed
• products are covered by them?
• Mean Time To Complete: What is the average time required to complete a work order from the time it is created?
• Average Response Time: What is the average % of visits within SLA?
• Utilization: What is the utilization of technicians’ total work hours for productive work (actual time spent servicing
• work orders in the field)?
• Repeat Visit: Which products required a repeat visit for servicing, within the specified time frame?
• Mean Time Between Failures: What is the average time a product functions between the failures?
• Account Summary: What is the monthly summary of each of the above metrics (except Utilization and Mean Time Between Failures) per account?
• Top Level Summary: What is the timely summary of these metrics (except Utilization, Attach Rate and Contract Up Time) at a top business process level?
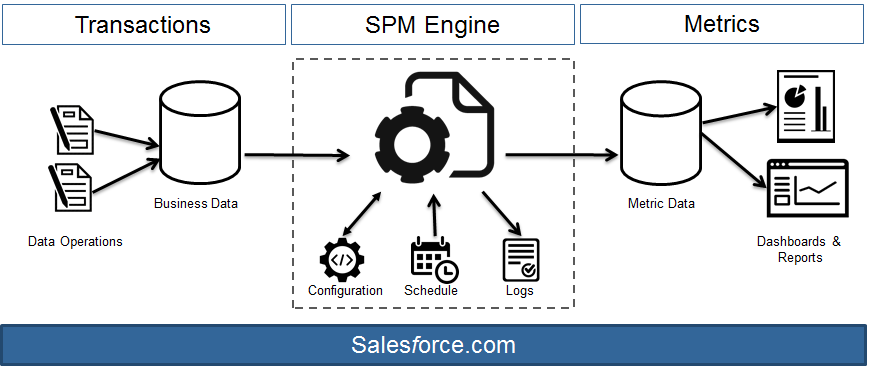
You can measure these metrics using a combination of simple configuration options which enable you to tweak them to suit your business needs. The ServiceMax SPM Engine gathers the required business data and calculates the metrics at scheduled intervals, based on your configuration. You can also define reports & dashboards using the Salesforce platform and visualize these generated metrics data in charts/graphs. The figure below illustrates this:
To know the technical details of how these metrics are calculated in ServiceMax, see section Metrics Calculation. To know about these metrics from a business perspective, see section Business Context. Important technical aspects related to the implementation of this feature are covered in the Technical Context section.