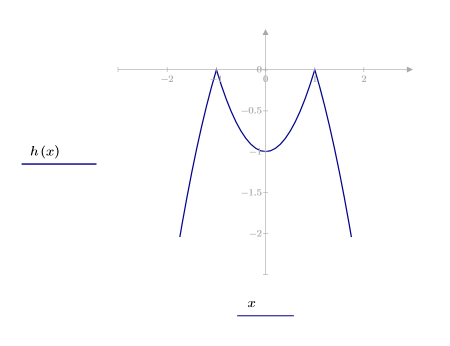
Example: Plotting Inequalities and Piecewise Functions
Use plots to visualize inequalities and piecewise functions.
Inequalities
1. In an empty plot, enter an inequality in the y-axis expression and the corresponding independent variable in the x-axis expression.
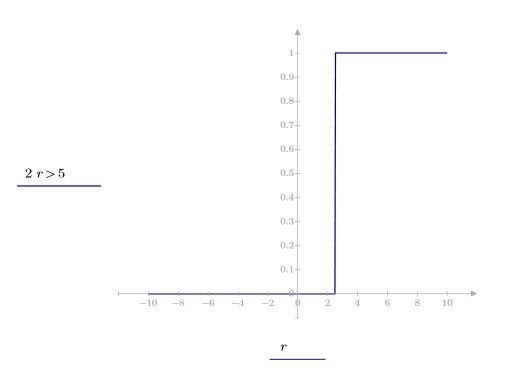
Since the inequality is a Boolean expression, PTC Mathcad plots both the values of r that are true (>2.5) and the values of r that are false (<2.5). The inequality is equal to 1 when it is true, and 0 when it is false. |
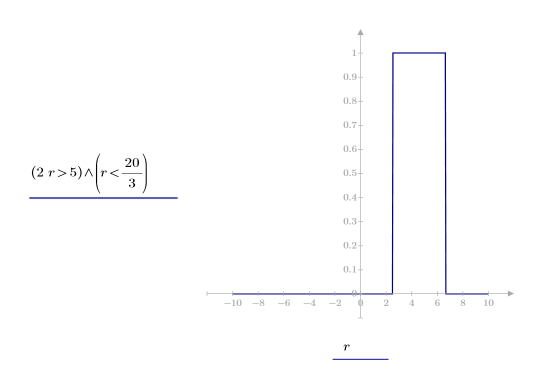
2. Use the AND operator to add a second inequality to the first one.
Piecewise Functions
A function that is not uniform over its domain is called a piecewise function. To plot a piecewise function you need to use the built-in conditional function if.
1. Define a function and plot it over a specific range.


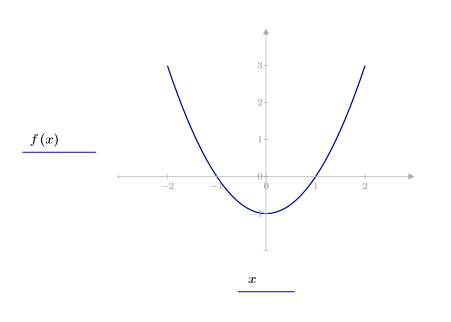
2. Define and plot a piecewise function that is equal to f(x) only when f(x) > 0.

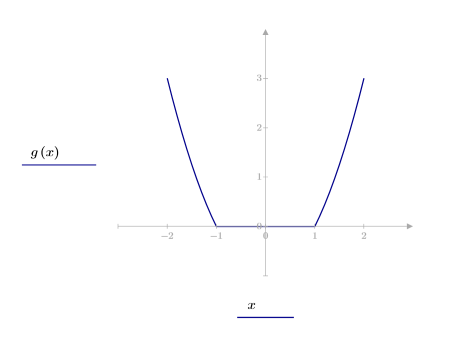
3. Use the AND operator to define the range of x over which f(x) is plotted as such. For other values of x, plot the negative of function f.

