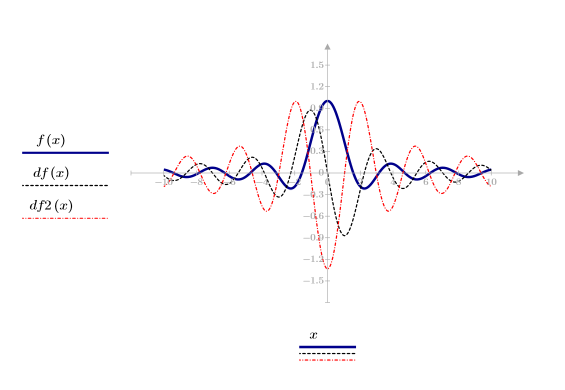
Example: Plotting a Function and Its Derivatives
Use plots to visualize functions and their derivatives.

2. Use the prime operator to define two functions to be the first and second derivatives of f.


3. Plot function f and its derivatives. To plot the last two traces, press Shift+Enter twice and type the additional y-axis expressions. You can change the trace style to better differentiate the traces.
