Example: 1 Factor ANOVA
Use the fullfact function to design an experiment, and the anova function to analyze the result of the experiment.
1. Define the number of factors in an experiment testing the effect of the amount of cotton fiber on the strength of a new synthetic fiber.

2. Define the cotton settings used in the experiment.
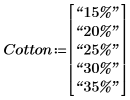
3. Use function length to define the number of levels for the factor.

4. Call function fullfact to create a full factorial design matrix representing the experiment and its runs.
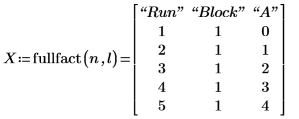
In the design matrix X, A represents the cotton factor, and its levels are shown in coded form:
Coded Values of A | Real Values of A |
|---|---|
0 | 15% |
1 | 20% |
2 | 25% |
3 | 30% |
4 | 35% |
5. Measure the strength of the synthetic fiber for the first run when the weight of the cotton fiber is 15%.

6. Take measurements for the four other runs.


7. Call function randomize to shuffle the run order.
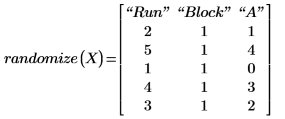
8. Replicate the measurements in the order determined by the randomize function.


Repeating experiments is useful to average out the effect of uncontrolled variables. Calling the randomize function before repeating the experiments helps to reduce any order of correlation between the input factors.
9. Repeat steps 7 and 8 for all the desired replicates. Record all the measurements in matrix Y.
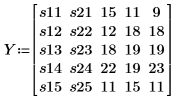
Each column contains the data of one of the replicates, and each row contains the data for a particular run.
10. Call function boxplot to prepare data for a box plot that has a box for each run.

Matrix Y is transposed because the results for each run are recorded in matrix rows, but the data sets that are fed to boxplot must be matrix columns.
11. Call function boxplotgraph.

12. Create a box plot.
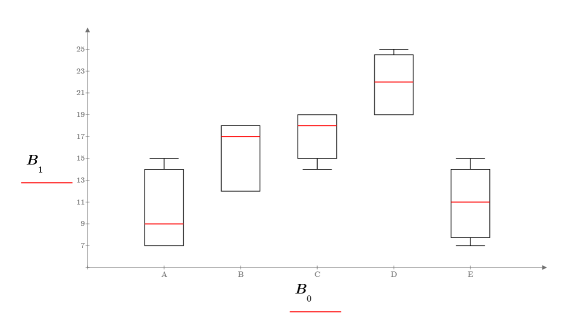
a. Plot the output of the boxplotgraph function:
b. Create text regions with the labels for each factor:
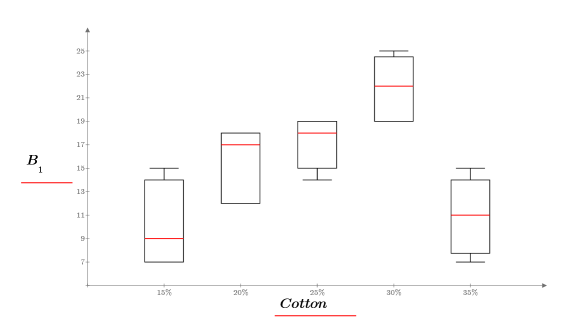
When looking at the box plot, it seems that the cotton weight percentage influences the tensile strength of the fiber. The tensile strength of the fiber reaches a maximum when the cotton weight is about 30% of the fiber weight.
13. Call function anova to test if the cotton weight percentage influences the tensile strength.

14. Define r to be the number of runs and x to be the number of replicates then calculate the sum of squares in the SSE column.


15. Define N to be the total number of measurements then calculate the degrees of freedom in the df column.


16. Calculate the mean squares in the MSE column.


17. Calculate the F-value for factor A.

The P-value in the P column is less than 0.05 which indicates that factor A is significant.
18. Use the F-value to test the hypothesis that A is a significant factor. Calculate the critical F value for a 5% significance level.


The F-value for factor A is greater than the critical F value which confirms once more that the cotton weight percentage does influence the tensile strength of the fiber.
Reference
Montgomery, D.C., Design and Analysis of Experiments, 5th ed., John Wiley & Sons, New York, 2001. 62.