3D Projection Options – Remove Hidden Lines
In the 3D Projection-Set dialog box, select remove hidden lines if you want to display your current 3D view in 2D mode with hidden lines removed (HLR). Select check boxes below remove hidden lines to add optional HLR effects.
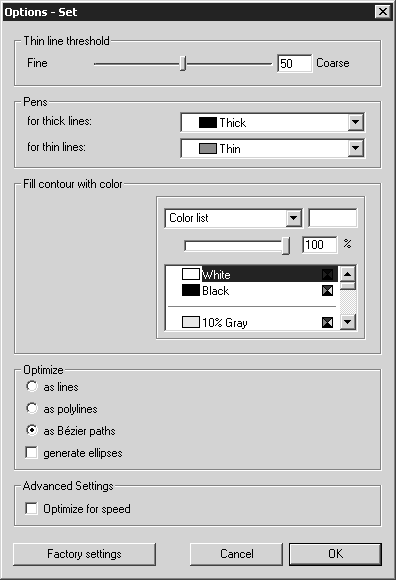
With remove hidden lines selected, you can view and change HLR illustration settings in the Options-Set dialog box:
• Thin line threshold – The rendering threshold for inner edges (…determines how many or how few inner edges are displayed).
• Pens – The Pen attribute settings used for thick and thin lines.
• Fill contour with color – The color used to fill the 3D set contour (white by default).
• Optimize – The graphical elements that edge lines and contours are converted into and saved as.
• Advanced Settings – Optimize illustration rendering speed.
To open the Options-Set dialog box:
1. In the 3D Projection-Set dialog box and click remove hidden lines.
2. (Optional) Select HLR illustration effect check boxes below remove hidden lines; create thick/thin lines, create surface borders, and create contour fills.
3. Click Options. The Options-Set dialog appears:
|
|
Color picking tools under Fill contour with color are only available when the create contour fills check box is selected.
|
Thin Line Threshold
This is where you can specify at which transitions between the triangular surfaces Arbortext IsoDraw CADprocess is to set thin lines, or inner edges.
| If you are importing IGES files, the number of possible inner edges is also determined by tessellation accuracy settings. (See 3D Options for more on tessellation accuracy.) |
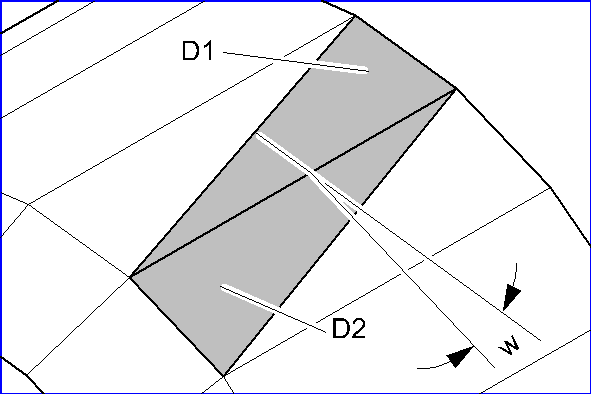
Inner edges can always be inserted where two adjacent triangles share an edge. The orientation angle (w) between both triangular surfaces (D1, D2) is used as the basis for calculating whether or not an inner edge is to be inserted.
This means that the larger the angle at which the triangles contact, the smaller the orientation angle between the triangular surfaces. By setting the threshold for this angle, you are deciding whether an inner edge appears. The finer your setting, the smaller the angles between triangular surfaces that will be used for calculating inner edges.
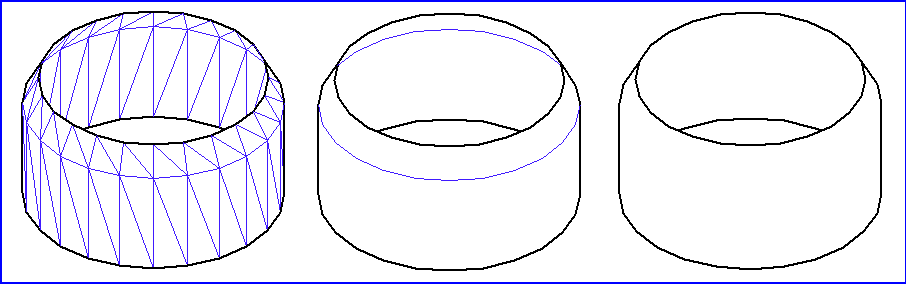
The following three examples will illustrate the effect of various threshold settings.
The example on the left shows the result at the finest setting possible. Inner edges have been inserted at all possible triangular edges. A good result has been achieved in the center example, where the threshold has been set at 20. Unwanted inner edges are not shown. Only the inner edge at the chamfer has been inserted. The example on the right depicts a very coarse setting. Too few or no inner edges have been inserted.
The value in the input field has no unit and is used as a preference for internal matching with the angle (w). You can enter values between 1 and 100. You can enter the value directly or use the slider.
| When working with IGES files in particular, the triangles are created by Arbortext IsoDraw CADprocess. Specifying tessellation settings also determines the number of triangles that are created. (See the 3D Options dialog page in Preferences.) This in turn affects the result of the inner edges that are applied. If you want to convert a 3D drawing containing a complex surface, use the default setting ( 50) for both the Tesselation Accuracy and Thin line threshold functions. Look at the result of the projection. If the result is not accurate enough or if there are excessive numbers of inner edges on the surfaces, modify the thin line settings. If you also want to change tessellation accuracy you must re-import the 3D data after adjusting the settings. If you have only changed thin line threshold settings, create a new version of the 2D projection. To accelerate this procedure, select as lines under Optimize. To ensure a compact file, select as Bézier paths for the elements in the final version. |
Particularly when working with large amounts of data, you can see the results of your thin line threshold settings in the current drawing in 3D mode before initiating the conversion process. This allows you to see a preview of the converted drawing without needing to delay the conversion process. The drawing must be depicted in HLR display mode to do this. To view the preview, select the Preferences menu command, then the 3D Options dialog page. Change the Thin line threshold on this dialog page. To make the new setting visible on the drawing, close the 3D Options dialog page by clicking OK.
Pens
This allows you to select the
pens to be used for outer and inner edges. Select the pen for the outer edges in the
for thick lines pop-up menu. Select the pen for the inner edges in the
for thin lines pop-up menu. All pens for the current file are displayed. Before the conversion, you can also create additional pens. These pens will also be displayed in the pop-up menus. The process for creating a new pen and the points you need to remember when doing so are described in
Show Attribute Window.
Fill Contour with Color
If you selected the create contour fills check box, you can change the color used to fill the 3D set contour under Fill contour with color. (The fill color is white by default.)
To change the contour fill color, click a different color in the lower Color list. The lower Color list shows all available colors in the current file. The color box next to the upper Color list shows the currently selected color.
To change the tone of (or, the amount of white in) the currently selected color, drag the Tone slider.
To change the contour fill color to a CYMK or RGB color you define:
1. Click Free CYMK color or Free RGB color in the upper Color list.
2. Adjust the CYMK or RGB color sliders until the color box shows the color you want. You can also enter percentage values for CYMK or RGB colors directly.
When you click OK to close the Options-Set dialog box, the color in the color box is the applied 3D contour fill color.
(For more information on creating and editing colors in
Arbortext IsoDraw, see
Fill Type — Color.)
Optimize
There are three ways for selecting how elements from the 3D data are to be defined as elements in the 2D illustration.
If you select as lines, the 2D illustration will only contain lines in the form of unconnected elements. If you select as polylines, several lines which follow on from each other are grouped together into polylines. Selecting as Bézier paths converts those elements of the 3D data, which follow on from each other into a Bézier path. Conversion to Bézier paths gives you the best results in terms of contour accuracy for the illustration. What is more, the number of elements is far lower than for line elements, what facilitates subsequent operation and also reduces storage requirements.
If you click the Generate ellipses box, the elements that together make up an ellipse form are converted into an ellipse or an ellipse segment. The ellipses generated in this way optimize the 2D illustration and are easier to use subsequently. For example, you can use the center point of an ellipse to easily change the orientation of a centerline.
You should only use the as lines setting if you want to try out different settings for surface smoothness and accuracy. You should then return to the as polylines or as Bézier paths setting. You should only select the generate ellipses option if the drawing contains numerous convertible elements.
Advanced Settings
If you click the Optimize for speed button, simplified calculations are carried out in some cases during conversion. This accelerates the conversion process. There is no generally valid rule for calculating the time this saves. This depends on the imported data format and the file content. Experience shows that the time saved increases in line with number of elements that change to inner edges in the 2D illustration.
Optimize for speed generally involves no loss of quality in the 2D illustration. If errors occur during the conversion process, you will be able to see this in the illustration. If this happens, switch off the function and repeat the conversion.
If you want to process a large number of files in the same format, select Optimize for speed for the first set of files. Examine the 2D illustrations. If the conversion is successful, leave the function switched on.
Factory Settings
If you click the Factory settings button in the Options dialog box, the settings in this window will be set to the selections recommended by the manufacturer. Experience has shown that these factory settings will deliver excellent Technical Illustrations for most 3D data.
Clicking Cancel exits the Options dialog box. All changes are rejected. Clicking OK applies the current setting status to the projection. The settings are applied until the next change is made.