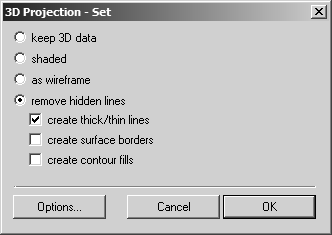
3D Projection
This dialog gives you various options for selecting how the current drawing is to be displayed in the normal Arbortext IsoDraw window.
Clicking Options results in another dialog box being displayed, where you can select further optimization settings.
Keep 3D Data
If you select keep 3D data, the drawing is depicted in 2D mode using the display mode that was last selected in 3D mode. You can only edit the drawing to a limited extent. It is not possible to create animations in 2D mode. As this type of projection preserves all 3D information, you can change to 3D mode at any time by choosing > . You can then edit the drawing in 3D mode.
| If animations have already been created for objects in 3D mode prior to projection, only the keep 3D data projection type can be selected in the 3D Projection-Set dialog box. |
Shaded
If you select shaded, the drawing appears in the Arbortext IsoDraw window as a raster image according to the display type selected in 3D mode. This type of projection is primarily intended for use with the shaded and Smooth rendering display types in 3D mode. The drawing is converted as a raster image containing all the colors specified in 3D mode. After conversion, the drawing can be changed using the image editing tools.
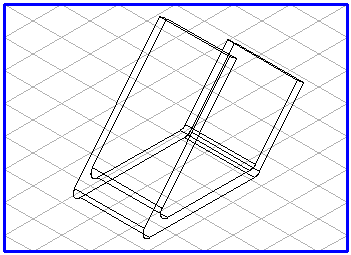
As Wireframe
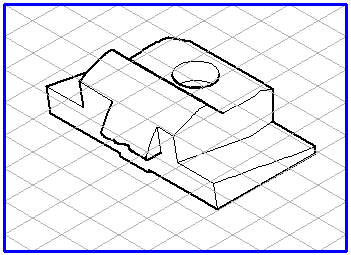
If you select as wireframe, all the elements in the 3D file will be transferred to the 2D illustration. The pens with their attributes from the 3D file are retained. The settings for optimizing the data in the Options dialog box cannot be selected.
The result of your 3D projection therefore corresponds to the original drawing from the CAD system.
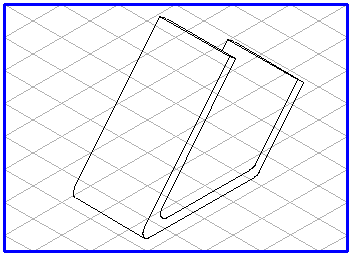
Remove Hidden Lines
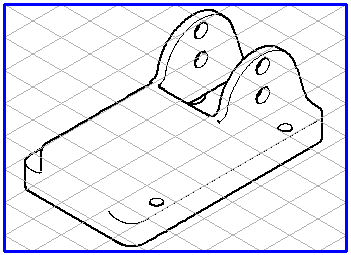
If you select remove hidden lines, the illustration will be displayed in your chosen perspective and orientation without hidden lines. This means that all elements are removed, which are invisible to the observer.
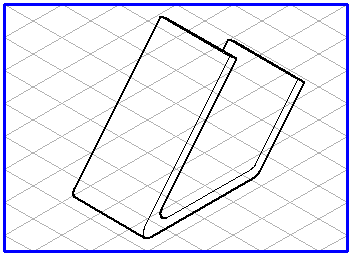
Create Thick/Thin Lines
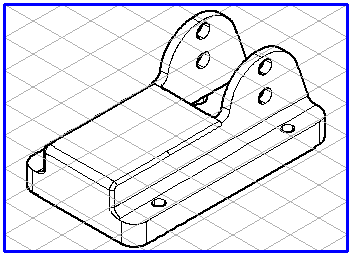
If you click the create thick/thin lines box, the illustration will show the distribution of thick and thin lines for outer and inner edges, which is typical for technical illustration. The pens for thick and thin lines can be assigned in the Options dialog box.
Selecting remove hidden lines with create thick/thin lines enabled allows you to create the key attributes of a technical illustration.
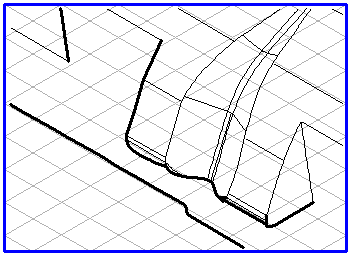
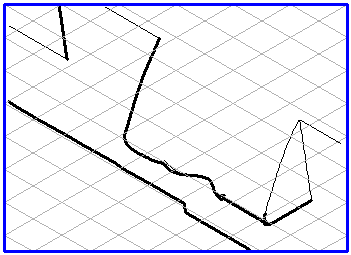
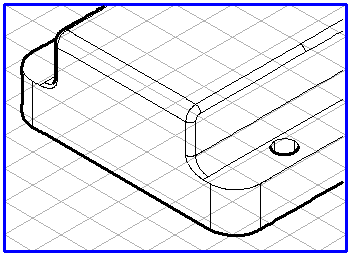
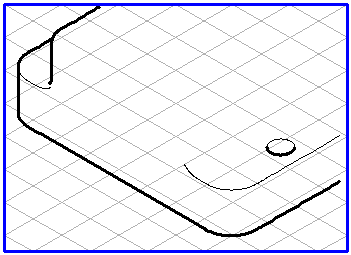
Create Surface Borders
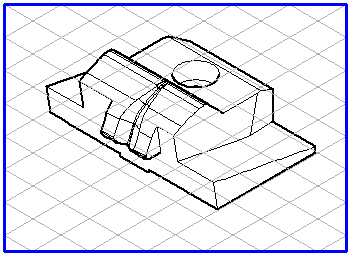
When importing 3D data, a large number of individual surface elements are loaded, particularly with the IGES format. If a file appears in 3D mode, you can easily recognize the surfaces with their delimiting lines as created in the CAD file.
The delimiting lines are recognized via hidden line removal and are converted as inner or outer edges into the 2D illustration. Situations can occur where it is not clear whether inner edges are to be converted from delimiting lines. This can be the case, for example, with difficult free-form surfaces or with two surfaces that meet at an obtuse angle.
For this reason, inner edges may be missing from the illustration.
If you select the create surface borders box, the missing inner edges are also converted from the delimiting lines. These lines are assigned a pen of their own in the 2D illustration. All lines that have been converted using the create surface borders function can be recognized easily since they are drawn with the Border pen. With the exception of screen color, the Border pen has the same attributes as the Thin pen.
When enlarged, you can clearly see the lines created with the create surface borders function. All lines that appear over and above those when converting without the create surface borders function are surface borders.
If you want to delete individual surface borders, you are best working in drawing mode. As the Border pen has a different screen color than the Thin pen the lines are easy to see in drawing mode. Change the surface borders that you wish to keep in the illustration to the required pen. You can delete the remaining borders like this: Choose > , then select all the elements that use the Border pen. Confirm the selection. You can then delete the elements.
When you import files in which all the individual surfaces have been defined as a single surface, you will not find any additional lines in the 2D illustration using the create surface borders function. In these cases, you can use the detailed settings Smooth rendering and Tessellation Accuracy.
If you make the appropriate setting, additional inner edges are set by Arbortext IsoDraw CADprocess. These inner edges are not surface borders.
Clicking Cancel allows you to exit the 3D Projection-Set dialog box. Clicking OK copies the 3D data into a normal Arbortext IsoDraw window in the form of a 2D illustration. All the 3D elements are converted to 2D elements in the background using the selected settings.
While the data is copied to the Arbortext IsoDraw window, the Optimize window appears on the screen and shows you how the conversion is progressing. The Arbortext IsoDraw window containing the illustration then appears with an untitled file name. It is behind the window containing the file in 3D mode. Select > or Save as and save the illustration as an Arbortext IsoDraw file. The file is still open in 3D mode. This allows you to create further views of the drawing in 3D mode. Each time you click OK in the 3D Projection-Set window, a new file window will be created containing a snapshot of the required situation.
| If you only want to create a 2D drawing, hold down the ALT key while clicking the camera button in the toolbar. The window containing the file in 3D mode is converted to a normal 2D window when you click OK in the 3D Projection-Set dialog box and appears with the name of the initial file. This option is particularly useful if you have little memory available. |
Create Contour Fills
Select the create contour fills check box under remove hidden lines to create a closed, filled Bézier path around the outer contour of the 3D set. To see the filled contour path in 2D mode after 3D projection, turn on Preview. (From the Window menu, point to Preview and then click Preview.)
The 3D set contour path is filled with a single color (white by default) and its outline is invisible. (The outline Pen attribute is set to No pen.)
To change the contour fill color for the 3D set you are projecting with remove hidden lines selected:
1. Verify that the create contour fills check box under remove hidden lines is selected.
| If the create contour fills check box is cleared, you will not be able to change the color. |
2. Click the Options button.
3. In the
Options-
Set dialog box, select a color under
Fill contour with color and then click
OK. (See the color selection instructions under
Fill contour with color in
3D Projection Options – Remove Hidden Lines .)
You can also change the 3D set contour fill color, and other 3D projection options, in the 3D Options preferences panel. Like other 3D Options preference settings for 3D projections, the scope of this contour fill color setting (specifically, which 3D set, or 3D sets, it applies to) depends on the state Arbortext IsoDraw CADprocess is in when you change the preference setting. (See Setting Contour Fill Color as a 3D Options Preference for 3D Projections.)
Example: 3D Set Contours with Different Colors
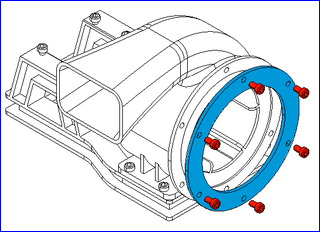
The example remove hidden lines illustration below has 3D set contours that are filled with different colors. This section describes how it was created.
Three 3D sets were used to create this illustration: One for the blower assembly, one for the flange (blue), and one for the six flange bolts (red).
The blower assembly 3D set was projected first without a filled contour. Next, the flange 3D set was projected with a blue-filled contour. Last, the 3D set containing the six bolts was projected with a red-filled contour.
The detailed steps used to create this example illustration are listed below for reference. Substitute your assemblies and parts for the blower assembly, flange, and bolts in these steps to create similar illustrations with color-filled 3D set contours.
1. Open (or Place) the 3D CAD file for the assembly in Arbortext IsoDraw CADprocess.
2. Prepare the view for 3D projection. In this example:
a. On the
3D Tools toolbar, click the
Isometric view top
button.
b. Right-click the flange and click Move. Move the flange +10 mm in the Z-axis direction.
c. Select the flange bolts.
d. Right-click one of the selected bolts and click Move. Move the bolts +20 mm in the Z-axis direction.
3. On the
3D Tools toolbar, click the
Convert to 2D illustration
button.
4. In the 3D Projection-Set dialog box, click remove hidden lines and clear the create contour fills check box.
5. Click OK to perform the 3D projection. In 2D mode, the assembly is shown with hidden lines removed and no filled contours.
6. Next, Place the flange and project it into 2D with a blue-filled contour:
a. Place the 3D CAD file and prepare the view as described in Steps 1 and 2 above.
b. Delete all the objects in 3D mode except the flange object.
c. Click the
Convert to 2D illustration button in the
3D Tools toolbar.
d. In the 3D Projection-Set dialog box, click remove hidden lines and select the create contour fills check box.
e. Click the Options button.
g. Click OK to perform the 3D projection. In 2D mode, the blue flange is displayed in front of the assembly.
7. To finish, Place the flange bolts and project them into 2D with their contours filled with red:
a. Repeats Steps 6(a.) through 6(g.) with these exceptions:
▪ In Step 6(b.), delete all the objects except the flange bolt objects.
▪ In Step 6(f.), select red for the contour fill color.
b. In the 3D Projection-Set dialog box, click OK to perform the 3D projection. In 2D mode, the red bolts are displayed in front of both the assembly and the blue flange.
Setting Contour Fill Color as a 3D Options Preference for 3D Projections
You can set the contour fill color (…and other 3D projection settings) on the 3D Options preferences panel. Consider setting this preference for one or all 3D sets in the following cases:
You always use the same contour fill color for:
• Case 1: A particular 3D set you project in multiple illustrations during an Arbortext IsoDraw CADprocess application session.
• Case 2: All 3D sets you project in one illustration.
• Case 3: All 3D sets you project in all illustrations.
To make a contour fill color preference setting (…or any other 3D projection setting) the default in each case above:
• Case 1: Set the preference in 3D mode with the 3D set active. This makes your setting the default whenever you project that particular 3D set during the current Arbortext IsoDraw CADprocess application session. If you exit and then restart the application, the default preference setting no longer applies to that particular 3D set.
• Case 2: Open the illustration file and set the preference in 2D mode. This makes your setting the default for all 3D sets you project in that illustration file. The default setting persists for that illustration file when you close and reopen it, and when you exit and restart the application.
• Case 3: Close all illustration files and then set the preference. This makes your setting the default for all 3D sets you project in all illustration files. The default setting persists for all illustration files when you close and reopen them, and when you exit and restart the application.
To set the contour fill color preference for one or all 3D sets (depending on the case above):
1. Select > and then select 3D Options…
◦ Case 1: …in 3D mode with the 3D set active.
◦ Case 2: …with the illustration file open in 2D mode.
◦ Case 3: …with all illustration files closed.
2. In the 3D Options preferences panel, click the 3D Options button to open the 3D Projection dialog box (or 3D Projection-Set dialog box for Case 1.)
3. Click remove hidden lines and select the create contour fills check box, and then click the Options button.
4. In the
Options dialog box (or
Options-
Set dialog box for Case 1) under
Fill contour with color, select the color. (See color selection instructions under
Fill contour with color in
3D Projection Options – Remove Hidden Lines .)
5. Click OK twice to close the dialog boxes, and then click OK to close the Preferences dialog box. The fill color preference setting is applied to the 3D set or 3D sets (depending on the case above).
About Editing 3D Set Contour Paths in 2D Mode
In 2D mode, the filled contour path is grouped with the 3D set. Use the
Arrow (+)

tool to select the contour path for editing while the 3D set is grouped. Or, you can ungroup the 3D set and then edit the path shape or fill color as you would any other filled Bézier path.
| Ungrouping a placed 3D set breaks the link to its source 3D data. |
The contour path is a single path around the outer contours of all objects in the 3D set. It is not a compound path, however. So, if the 3D set includes objects with holes (such as the flange in the example above) or multiple, separate objects (such as the bolts in the example above), the path will have connecting lines between distinctly separate parts of the contour. If you make the contour outline visible by applying a different Pen attribute, you may have to edit the path to remove these connecting lines.