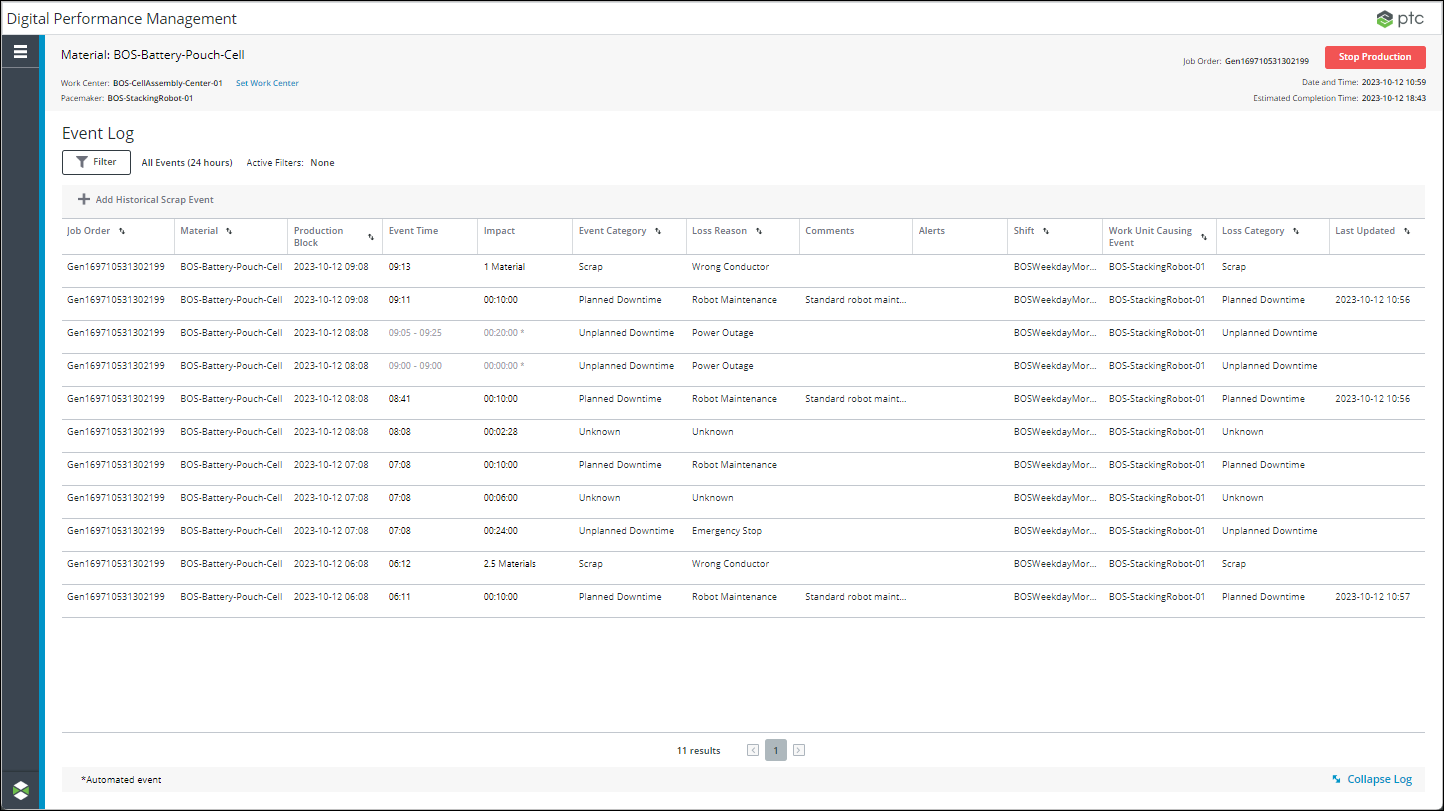
Expanded Event Log View
The expanded view of the event log displays all loss events for the work center for the past 24 hours, loss events with alerts for the past 24 hours, or all loss events for the past 12 days, depending on your filter settings. By default, both automated and manual events are displayed. The current event view is shown above the event log, and defaults to All Events (24 hours) when the expanded event log is initially opened.
You can change the event view and narrow down the list of events that are displayed by applying filters from the Filters pane. If you have filtered for only automated or manual events, that is indicated next to the event view, for example, Alerts Only (24 hours) | Automated. The names of all other currently applied filters are listed in the Active Filters field above the event log. Click Filter to open the Filters pane. For more information about filtering the expanded event log, see Filtering the Expanded Event Log
To add scrap events for a completed production block, click Add Historical Scrap Event. For more information, see Entering Historical Scrap Events.

For each loss event, the following information is displayed:
Column | Description | ||
|---|---|---|---|
Job Order | The job order associated with the event. If the loss event is entered for a time-gap production block, this field is blank. This field may be blank for automated loss events. | ||
Material | The material associated with the event. This field is blank if the event is entered for a time-gap production block. This field may be blank for automated loss events. | ||
Production Block | The date and start time of the production block during which the event occurred. This field may be blank for automated loss events. | ||
Event Time | For automated and manual loss events, the time when the entry was recorded. | ||
Impact | The quantity for scrap loss events or duration for all other loss events. The duration for an event is displayed in the format HH:mm:ss. If the impact duration exceeds 23 hours, 59 minutes, and 59 seconds, number of days is displayed along with hours, minutes and seconds. For example, 1d 15:10:30.
| ||
Event Category | The loss category for the event on the pacemaker. | ||
Loss Reason | The loss reason for the event. If a reason category is selected or no loss reason is selected for the event, the loss reason is blank. | ||
Comments | The comments for the event, if any. | ||
Alerts | The alert icon ( | ||
Shift | The name of the shift during which the event occurred. If the loss event occurred outside of a scheduled shift, then Overtime displays. This field may be blank for automated loss events. | ||
Work Unit Causing Event | The work unit which caused the event to occur on the pacemaker. If the pacemaker is selected as the Work Unit Causing Event, you can only select reasons from the loss category matching the selected Event Category. If a work unit other than the pacemaker is selected as the Work Unit Causing Event, you can select any loss reason that is valid for the selected work unit from any loss category. | ||
Loss Category | The loss category for the event on the Work Unit Causing Event. If the Work Unit Causing Event is the pacemaker, then the Loss Category is the same as the Event Category. If the Work Unit Causing Event is not the pacemaker, then the Loss Category can be different from the Event Category. | ||
Last Updated | The date and time when the event was most recently edited. If the event has not been edited, this column is blank. |
The list is sorted on Production Block by default with the most recent loss event at the top. The list can also be sorted on the following columns: Job Order, Material, Event Category, Loss Reason, Work Unit Causing Event, Loss Category, Loss Reason, Shift, and Last Updated.
All users are able to edit manually entered and automated loss events for the first 24 hours after they are entered. After 24 hours, only users who have been granted permission can edit manually entered and automated loss events. For more information, see Granting User Permissions for Editing and Deleting Loss Events. |
The total number of events display at the bottom of the table. To move between results on different pages, click  or
or  , or click a page number to go to that page.
 or
or  , or click a page number to go to that page.
To return to the collapsed event log view, click Collapse Log.