Filtering the Expanded Event Log
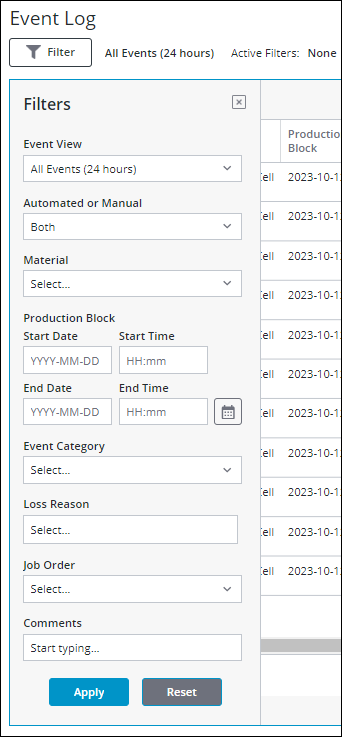
Initially, the expanded event log displays all loss events for the work center, both automated and manual, for the past 24 hours. You can change the event view and narrow down the list of events that are displayed by applying filters from the Filters pane.
Click Filter on the expanded event log to open the Filters pane. The Filters pane opens on top of the event log table. You can click Filter or  to close the Filters pane.
The event view and the applied filters are always displayed above the event log, whether the Filters pane is open or closed. If you have filtered for only automated or manual events from the Automated or Manual filter, this is indicated next to the event view, for example, Alerts Only (24 hours) | Automated. The names of all other currently applied filters are listed in the Active Filters field.

To apply filters to the expanded event log, complete the following steps:
1. In the Filters pane, select the appropriate filter values. All filters are optional.
◦ Event View—Select the event view and its duration. You can view events for a maximum of 12 days.
▪ All Events (24 hours)—Displays all events for the past 24 hours. This is the default view.
▪ Alerts Only (24 hours)—Displays only those events with alerts from the past 24 hours.
▪ All Events (12 days)—Displays all events for the past 12 days, the maximum, by default.
◦ Automated or Manual—Displays automated events only, manual events only, or both. The default is Both.
◦ Job Order—Select one or more job orders for which you want to view events. The list display job orders based on the Event View option that you have selected. You can narrow down the list of job orders by entering text in the  field of the dropdown list. Wildcard search is not supported.
◦ Material—Select a material for which you want to see the event. The list display materials based on the Event View option that you have selected. You can narrow down the list of materials by entering text in the  field of the dropdown list. Wildcard search is not supported.
◦ Production Block—Select a date range to see events for all production blocks which start, end, or occur during that date range. To apply this filter, you must specify the start date, start time, end date, and end time. The end time must be later than the start time. The start and end times cannot be later than the current site time. The selected dates and times must be within the range of the event view.
◦ Event Category—Select one or more event categories.
◦ Loss Reason—Select one or more loss reasons from the Select Loss Reason list and click Select. The list contains all the reason categories and the loss reasons for the work center. The total number of selected reason categories and reason categories for which you have selected loss reasons is displayed as the value for this filter.
◦ Comments—Enter one or more keywords to search the comment for which you want to see.
2. Click Apply. The expanded event log displays those events which satisfy the applied filter selections.
Click Reset to clear all selected filter selections.