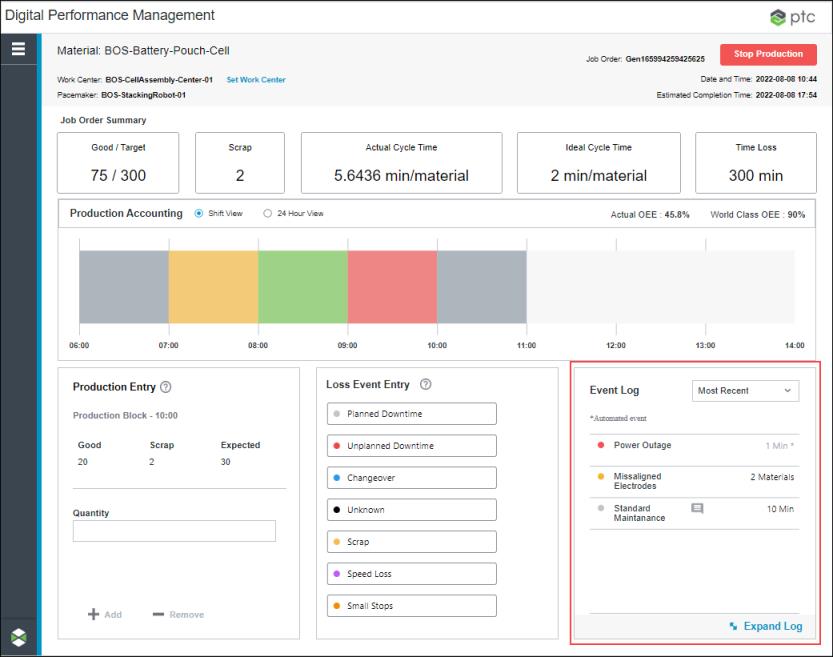
Collapsed Event Log Mashup
|
|
This mashup is designed to be easily replaced with a customized mashup so long as the customized mashup has the same inputs and outputs. For more information, see Replacing Modular Mashups.
|
The collapsed event log mashup (PTC.ProductionDashboard.CollapsedEventLog_MU) displays the most recent loss events for the current production block in the Event Log pane. By selecting a view from the drop-down list, you can choose to view the loss events ordered chronologically, ordered so that loss events with alerts appear first, or displaying only loss events with alerts. Events that were entered through data automation are indicated with an asterisk ( * ). Click Expand Log to view the expanded event log.

Widgets
The PTC.ProductionDashboard.CollapsedEventLog_MU mashup uses the following widgets:
• A DropDown widget, for selecting the view order: Most Recent, Alerts First, Alerts Only.
• Multiple Label widgets for text strings.
• A Contained Mashup widget which shows either the empty view (PTC.ProductionDashboard.NoEventLogs_MU) or the event grid (PTC.ProductionDashboard.CollapsedEventLogGrid_MU).
• A Button widget for the Expand Log button.
Inputs
The input parameters for the PTC.ProductionDashboard.CollapsedEventLog_MU are:
• timeZone—The time zone for the site to which the selected work center belongs.
• noEventLogMashupName—The mashup configured to display for the NoEventLogView id in the MashupConfiguration configuration table on the PTC.ProductionDashboard.Manager.
• workCenterThingName—The Thing name of the selected work center.
• eventLogUpdateTimestamp—The timestamp for the most recent loss event, availability event, or production event that is entered for the pacemaker of the selected work center. When this timestamp changes, the event log updates.
• manager—The manager from which the dynamic services on this mashup are run.
• productionBlock—An infotable containing information on the current production block.
• thingName—The Thing name of the pacemaker for the selected work center.
• expandLog—A flag indicating whether the event log is in the collapsed view or the expanded view.
Outputs
The output parameters for the PTC.ProductionDashboard.CollapsedEventLog_MU are:
• expandLog—A Boolean indicating whether the event log is in the collapsed view or the expanded view.
Services
The mashup uses the following dynamic services from the PTC.ProductionDashboard.Management_TS Thing Shape:
• GetEventLogData—Retrieves the events to display in the event log.
• GetEventLogSortingOptions—Retrieves the options shown in the sorting drop-down list.
Dynamic services allow you to select the entity to execute a service at runtime. In this case, the service can be executed from any entity that implements the ThingShapename Thing Shape. For more information, see Dynamic Services in the Mashup Builder section of the ThingWorx Help Center.