Status Threshold Tab
On the Status Threshold tab, you can view and set the status thresholds for the metric. These are the thresholds between the Poor, OK, and Good value ranges for metrics with a positive or negative correlation. The Status Threshold tab is not applicable for metrics with neutral correlation and does not show any information.
Each value range is associated with a color:
• Poor—red ( ).
).
• OK—yellow ( ).
).
• Good—green ( ).
).
• Neutral—Grey ( ).
).
You can access the Status Threshold tab by viewing a metric from the Metrics page.
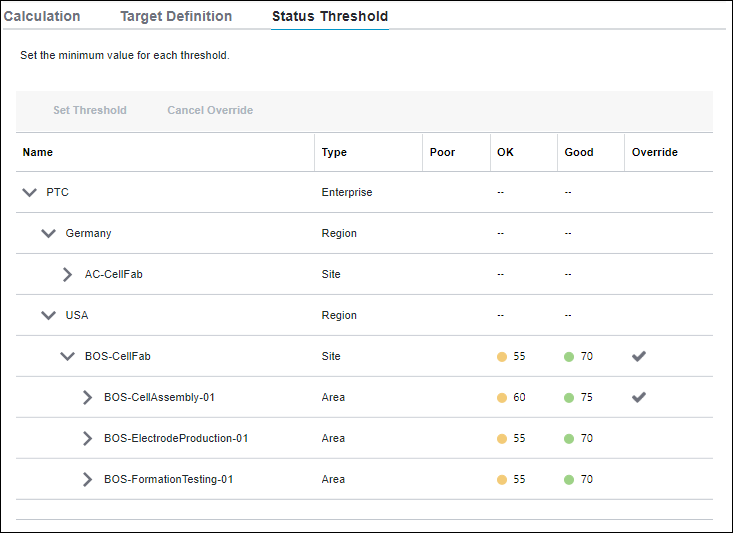
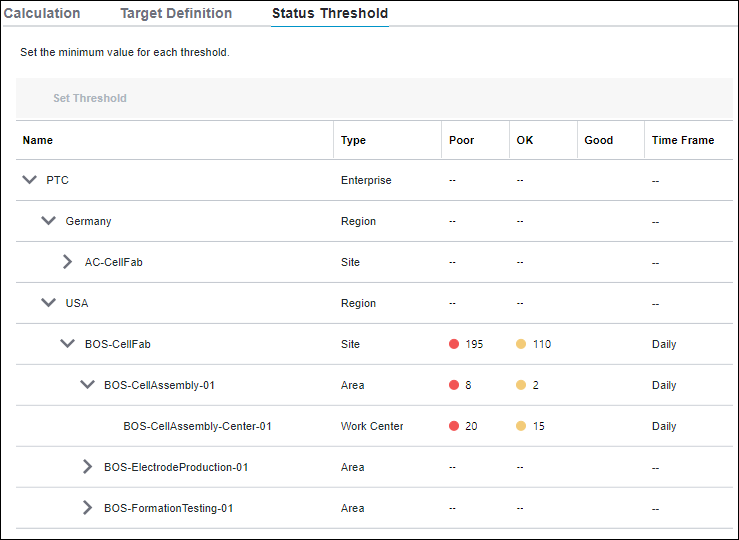
In the status threshold table, for each piece of equipment, the Name and Type columns display, along with columns showing the threshold values between the Poor, OK, and Good value ranges. For a positive correlation, the OK and Good columns display the specified values. For a negative correlation, the Poor and OK columns display the specified values.
The value ranges that are specified in this tab determine the color shown for the metric in the Status column of the Scorecard metric table. For example, if the value falls in the Good range, then the color shown in the Status column for the metric is green.
Status Threshold and Average Roll-Up Behavior
For metrics with the average roll-up behavior, a child automatically inherits the status threshold settings from its parent equipment. When the status threshold value is overridden for a piece of equipment, its children inherit the overridden values.
A checkmark in the Override column, indicates that the inherited value has been overridden.

For a positively correlated metric, when the status threshold value that is inherited from a parent is overridden on a child, the threshold values in the OK and Good columns are updated. For a negatively correlated metric, when the status threshold value that is inherited from a parent is overridden on a child, the threshold values in the Poor and OK columns are updated. A a checkmark is displayed in Override column on the equipment where the status threshold value was explicitly set. Since the first level of the equipment hierarchy does not have a parent from which it can inherit values, the override feature is not applicable at the enterprise level.
To revert to an inherited value, select the piece of equipment and click Cancel Override. The overridden value for the selected equipment and its children is replaced by the inherited value in the appropriate columns and the checkmark is removed from the Override column.
Status Threshold and Aggregate Roll-Up Behavior
Metrics with the aggregate roll-up behavior do not inherit status threshold values. Their status threshold values must be specified for each piece of equipment, along with the time frame. The selected time frame, Daily or Weekly, is displayed in the Time Frame column of the status threshold table. The time frame that is specified here is used to calculate the normalized status value and display the appropriate color and status for the metric in the Scorecard metric table.

Setting the Status Threshold Value
To set a status threshold value, complete the following steps:
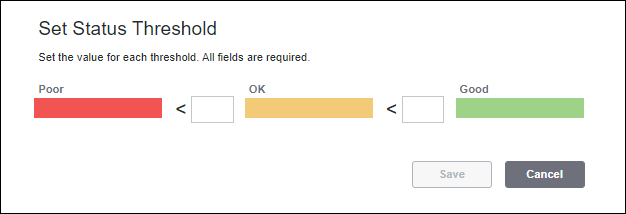
1. Select a piece of equipment from the status threshold table and click Set Threshold. The Set Status Threshold window opens. The following image is an example of a metric with the average roll-up behavior with a positive correlation.

2. Specify the value for each threshold. Required.
The value can be up to 13 digits, including 1 decimal and the decimal point.
For a positively correlated metric, the value between Poor and OK must be lesser than the value between OK and Good.
For a negatively correlated metric, the value between Poor and OK must be greater than the value between OK and Good.
3. For metrics with the aggregate roll-up behavior, specify the time frame as Daily or Weekly. The selected time frame is displayed in the Time Frame column of the status threshold table. The time frame that is specified here is used to calculate the normalized target value that is displayed for the metric in the Scorecard metric table.
4. Click Save to save your settings and return to the Status Threshold tab. For a positive correlation, the OK and Good columns display the specified values. For a negative correlation, the Poor and OK columns display the specified values.
You can click Cancel to discard the specified values.