Bottleneck Analysis Modular Mashups
The bottleneck analysis section of Performance Analysis includes the following modular mashups. These modular mashups can be replaced by editing the MashupConfiguration table on the PTC.BottleneckAnalysis.Manager. For more information, see Replacing Modular Mashups.
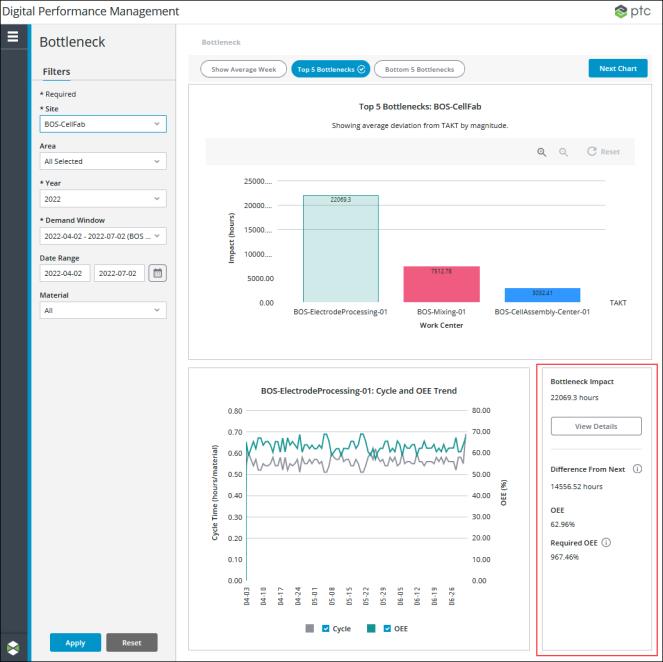
Bottleneck Mashup
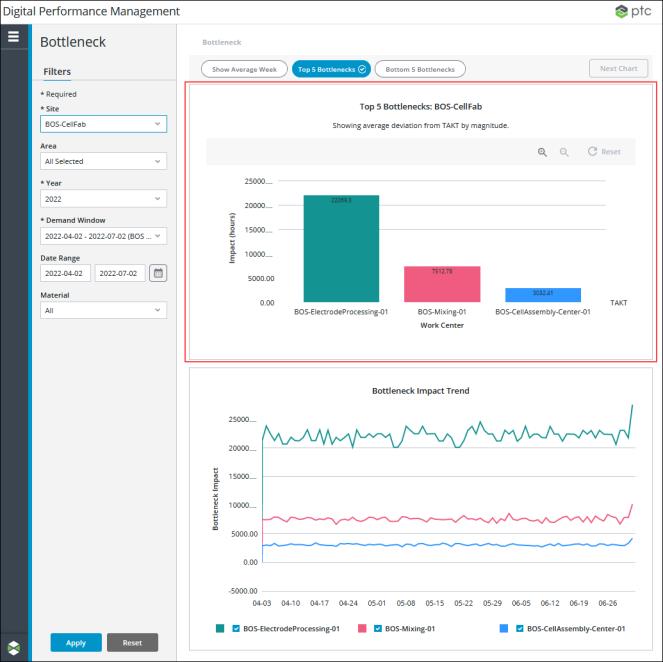
• Original mashup name: PTC.BottleneckAnalysis.Bottleneck
• id value in the MashupConfiguration table: PTC.BottleneckAnalysis.Bottleneck_MU
• For more information, see Bottleneck Mashup.
Bottleneck Cycle and OEE Trend Mashup
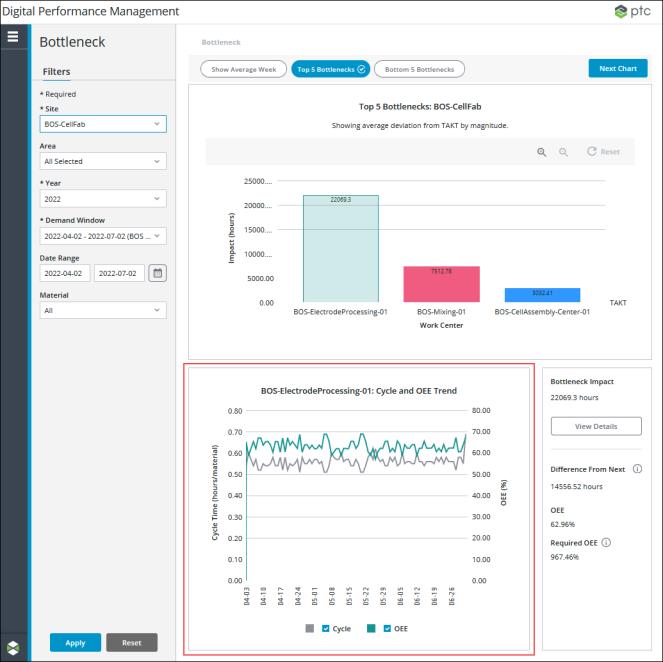
• Original mashup name: PTC.BottleneckAnalysis.BottleneckOEETrend_MU
• id value in the MashupConfiguration table: PTC.BottleneckAnalysis.BottleneckOEETrend
• For more information, see Bottleneck Cycle and OEE Trend Mashup.
Bottleneck Details Mashup
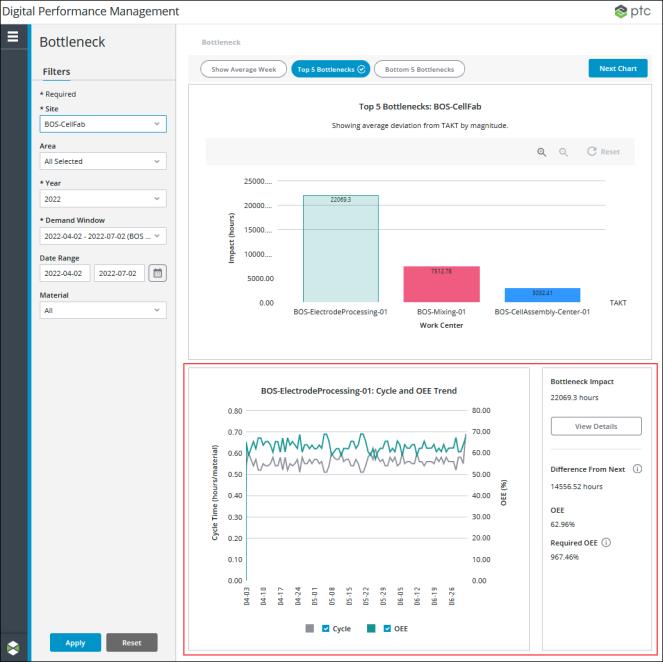
• Original mashup name: PTC.BottleneckAnalysis.BottleneckDetails_MU
• id value in the MashupConfiguration table: PTC.BottleneckAnalysis.BottleneckDetails
• For more information, see Bottleneck Details Mashup.
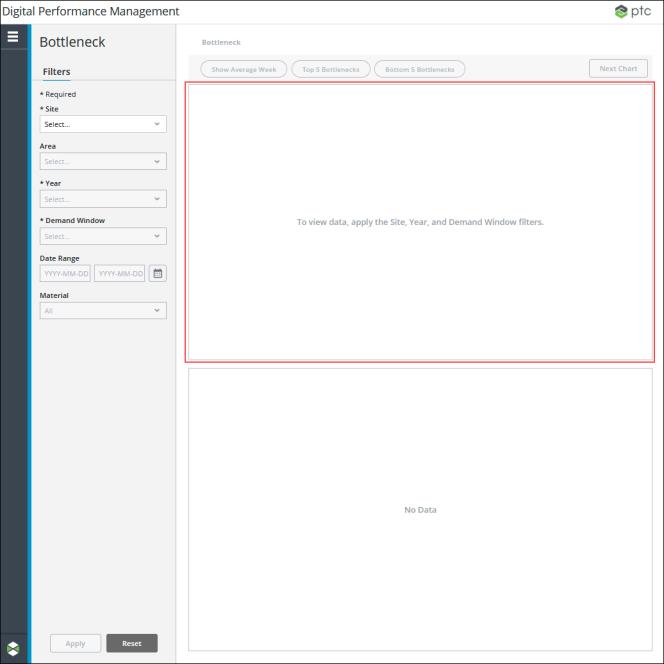
Empty Bottleneck Mashup
• Original mashup name: PTC.BottleneckAnalysis.EmptyBottleneck_MU
• id value in the MashupConfiguration table: PTC.BottleneckAnalysis.EmptyBottleneck
• For more information, see Empty Bottleneck Mashup.
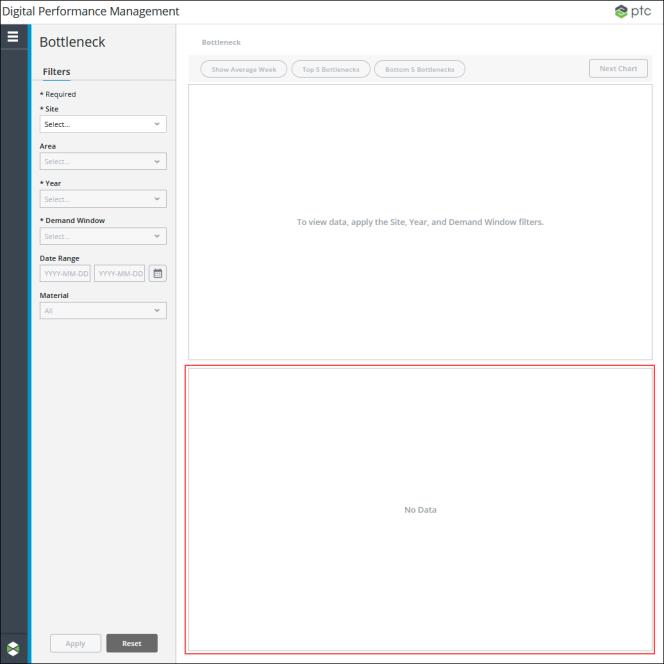
Empty Details Mashup
• Original mashup name: PTC.BottleneckAnalysis.EmptyDetails_MU
• id value in the MashupConfiguration table: PTC.BottleneckAnalysis.EmptyDetails
• For more information, see Empty Details Mashup.
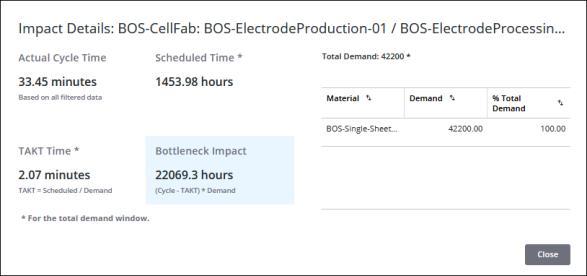
Work Center Additional Details Mashup
• Original mashup name: PTC.BottleneckAnalysis.WorkCenterAdditionalDetails_MU
• id value in the MashupConfiguration table: PTC.BottleneckAnalysis.WorkCenterAdditionalDetails
• For more information, see Work Center Additional Details Mashup.
Work Center Details Mashup
• Original mashup name: PTC.BottleneckAnalysis.WorkCenterDetails_MU
• id value in the MashupConfiguration table: PTC.BottleneckAnalysis.WorkCenterDetails
• For more information, see Work Center Details Mashup.
