Insert a Chart component, define the X and Y expressions for two different traces, plot the traces, and then double-click the plot area to open the PTC Mathcad Chart application.
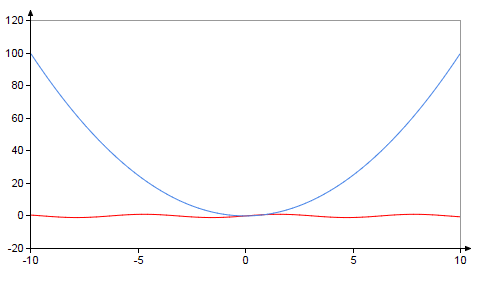
The chart below appears in the graphics area:
To add a second y-axis:
1. Click the Axes tab.
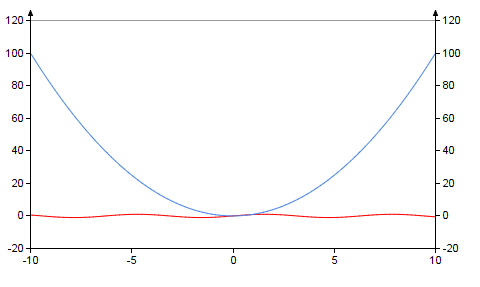
2. In the Secondary Y-axis group, click the Add 2nd Y-axis button. The plot is updated accordingly:
The second y-axis is added to the right side of the plot, using the same minimum and maximum tick mark values as the y-axis.
To Move the Trace
1. Click the red trace in the chart to select it.
2. Click the Setup tab.
3. Select the Setup checkbox.
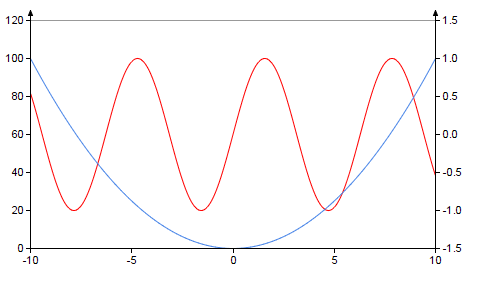
4. Select Y2 from the Y-axis drop-down list. The chart is updated accordingly, showing the red trace plotted with respect to the Y2 scale:
5. To delete the second y-axis and restore the second trace to its original reference, in the Secondary Y-axis group, click the Delete 2nd Y-axis button. The plot is updated accordingly.