The PTC Mathcad Chart application provides you with a number of trace style templates.
When you define a single trace in your worksheet’s Chart component using X1 and Y1, the PTC Mathcad Chart application displays the trace #1 icon after the and icons.
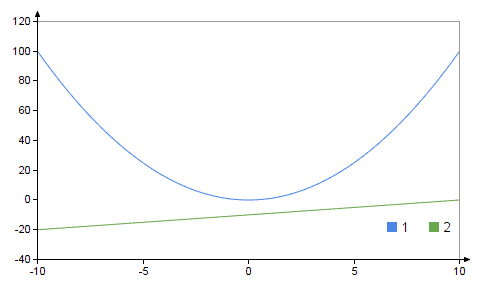
When you define a second trace in your worksheet’s Chart component using X2 and Y2, the PTC Mathcad Chart application displays the trace #2 icon , as shown below:
Note that the Chart Legend checkbox shows, by default, the trace numbers 1 and 2:
The trace number in the icon and the legend depends on the trace index as defined in the chart component. For example, if you define the second trace using Y5 then the PTC Mathcad Chart application displays the trace #5 icon .
Your worksheet’s Chart component can contain definitions for up to 50 traces.
The PTC Mathcad Chart application allows you to perform the following tasks on each trace:
• Styles:
◦ Line: Color, Style, and Thickness
◦ Symbols: Color, Shape, Thickness, Weight, and Opacity
 after the
  and
and  icons.
 , as shown below:
 .
.