Insert a Chart component, define the X and Y expressions, plot the trace, and then double-click the plot area to open the PTC Mathcad Chart application.
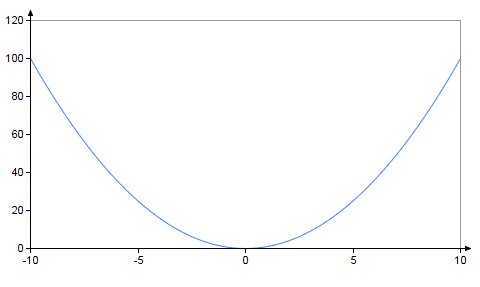
The chart below appears in the graphics area:
The PTC Mathcad Chart application allows you to format the trace style and type. To format the first trace, click its trace icon .
To Format the Trace Style
1. Click the Styles tab.
2. Select the Line checkbox and set the Color, Style, and Thickness.
3. Select the Symbols checkbox and set the Color, Shape, Thickness, Weight, and Opacity.
4. Select the Area checkbox and set the Fill type, Fill, and Opacity.
Use the same procedure to change the style of other traces.
To Format the Trace Type
1. Click the Setup tab.
2. Select the Setup checkbox.
3. Open the Trace type drop-down and select Scatter/ Line/ Area or Columns.
Selecting Columns applies only when the X and Y expressions are defined in terms of vectors in the Chart component.
Use the same procedure to change the type of other traces.
To restore the formatting settings of any group, click the clear formatting icon .
 .
.