Chart has two types of separators: Decimal and Thousand.
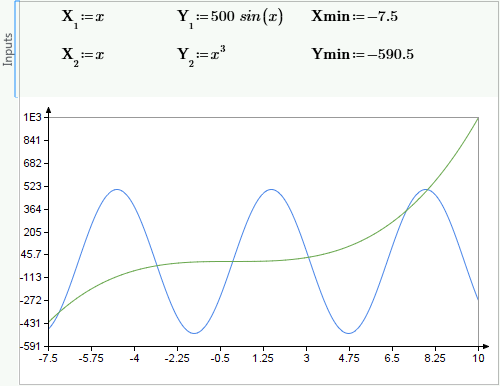
1. Insert a Chart component and define the input expressions as shown below:
The Chart separators have the following default settings:
• Decimal: period, or 3.142
• Thousand: no separator, or 1000000
2. Double-click the plot area to open the PTC Mathcad Chart application.
3. In the PTC Mathcad Chart application, click the Axes tab.
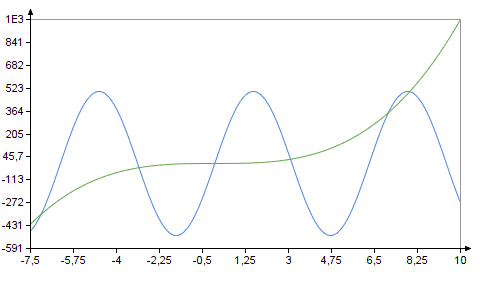
4. In the Separators group, open the Decimal drop-down list and select 3,142. The plot is updated accordingly, showing the X-axis and Y-axis tick mark values using the comma separator:
Changing the setting of a separator affects all displayed numbers within the chart.
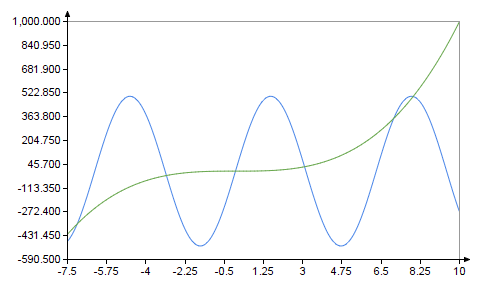
5. Select the Y-axis tab, Setup tab, and change the Format to Decimal: 50000.
6. Change the Decimal separator back to 3.142, and change the Thousand separator to 1,000,000. The plot is updated accordingly, showing the tick mark values using the new separators: