To Change the Number Formatting of Axes Values
Chart supports four number formats: General: 5 * E4, Decimal: 50000, Scientific: 5 * E+4, and Percent: 5 000 000%.
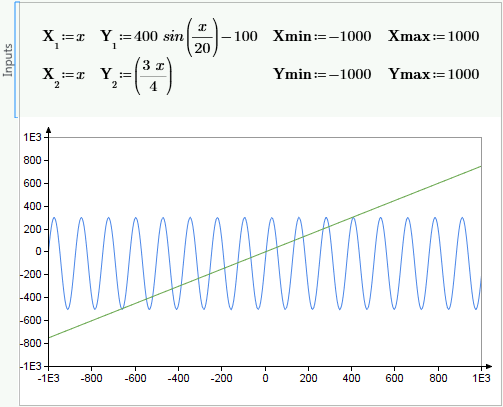
1. Insert a Chart component and define the input expressions as shown below:
| The axes values have the following default settings: • Format:General: 5 * E4 • Exponential Threshold:3 The high Y-axis tick mark value of 1000 is displayed as 1E3. |
2. Double-click the plot area to open the PTC Mathcad Chart application:
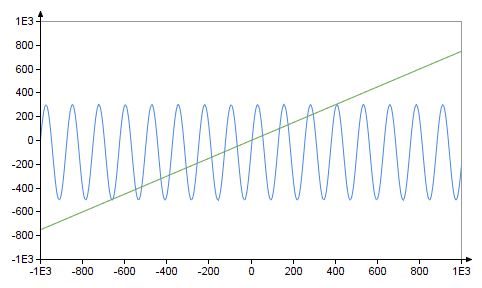
3. For the X-axis, on the Setup tab:
a. Select Decimal: 50000 from the Format drop-down list. The Exponential Threshold: option is replaced by two related fields:
▪ Decimal Places:—Default value is 0.577(3)
▪ Trailing Zeroes:—Default value is OFF
b. Set Decimal Places: to 0.577(1), and click the Trailing Zeroes: button.
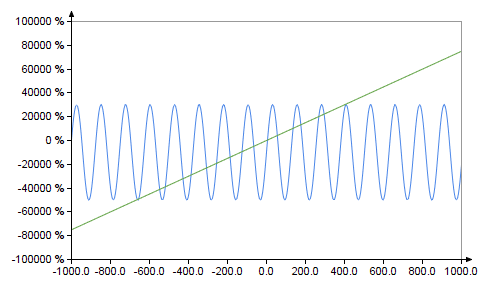
4. For the Y-axis, on the Setup tab:
a. Select Percent: 5 000 000% from the Setup, number format drop-down list.
▪ Decimal Places:—Default value is 0.577(3)
▪ Trailing Zeroes:—Default value is OFF
b. Set Decimal Places: to 0.577(0).
The plot is updated accordingly, showing the selected number formatting for the X-axis and the Y-axis: