Insert a Chart component, define the X and Y expressions, plot the trace, and then double-click the plot area to open the PTC Mathcad Chart application.
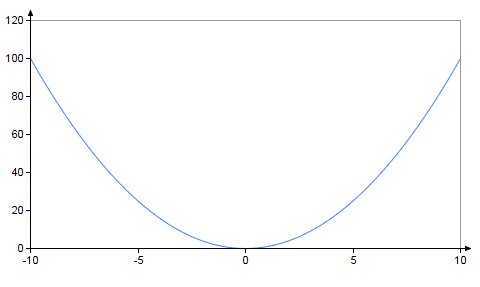
The chart below appears in the graphics area:
To format the x-axis:
1. In the PTC Mathcad Chart application sidebar, click the x-axis icon .
Alternatively, click the x-axis in the chart.
2. Click the Styles tab.
3. Select the X-axis checkbox to set the Tick Marks, Arrow, Color, Style, and Thickness options.
4. Select the Tick Marks Values checkbox to set the Font, Color, Styles, Size, Angle, and Offset options.
5. To clear the formatting of X-axis, Tick Marks, or Tick Marks Values, click the clear formatting icon located to the right of the relevant group. This restores the x-axis group to its default settings.
Use the same procedure to format the primary or the secondary y-axis.
 .
.