Insert a Chart component, define the X and Y expressions, plot the trace, and then double-click the plot area to open the PTC Mathcad Chart application.
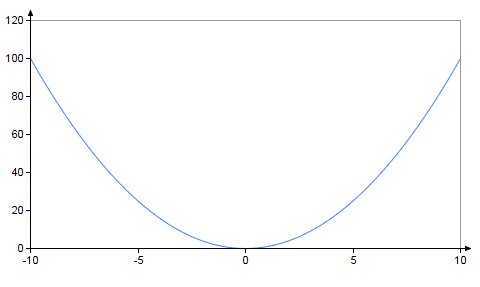
The chart below appears in the graphics area:
To edit the x-axis range:
1. In the PTC Mathcad Chart application sidebar, click the x-axis icon .
2. Click the Setup tab.
3. Select the User-Defined Range checkbox to set the Minimum, Maximum, and Steps.
4. Select a Scaling option—Linear or Logarithmic.
5. Select a Location option—Bottom or y = 0.
The Location option for the y-axis has two values: Left or x = 0.
6. Select a number format option—General: 5 * E4, Decimal: 50000, Scientific: 5 * E+4, or Percent: 5 000 000%.
Use the same procedure to edit the primary or the secondary y-axis range.
 .
.