The PTC Mathcad Chart application allows you to change the trace type from the default Scatter/ Line/ Area to Columns.
To use the Columns trace type, you must define X and Y as vectors of equal lengths.
1. Define the X and Y axis expressions in the Chart component as vectors:
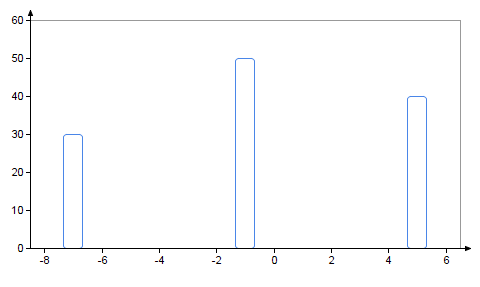
2. Plot the trace, and then double-click the plot area to open the PTC Mathcad Chart application. The chart below appears in the graphics area:
3. Click the trace in the plot area, or the trace icon , to select it.
4. Click the Styles tab.
When the trace type is set to Scatter/ Line/ Area, the Styles tab shows three checkboxes that you can use to format your trace: Line, Symbols, and Area.
5. Click the Setup tab.
6. Select the Setup checkbox.
7. Open the Trace type drop-down and select Columns. The chart is updated accordingly, showing that the trace is converted to columns:
8. Click the Styles tab.
When the trace type is set to Columns, the Styles tab shows two checkboxes that you can use to format your trace: Columns and Fill.
9. Select the Columns checkbox and set the desired options.
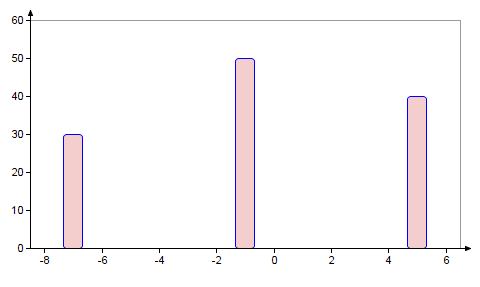
10. Select the Fill checkbox and set the desired options.
The chart is updated accordingly. For example, this chart shows columns that are filled with solid pink color:


 , to select it.