To Add and Format a Title
1. Click the
Chart icon

, and then click the
Title tab.
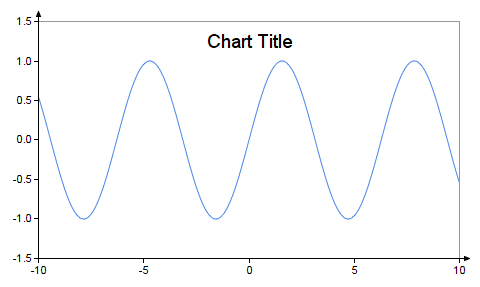
2. Select the Chart Title checkbox. A title appears automatically in the chart, populated with the default location and text.
3. Specify the Text, Location, Font, Color, Styles, Size, and Angle.
4. Select the Border checkbox and specify the Color, Style, Thickness, and Corners.
5. Select the Background checkbox and specify the Fill and Opacity.
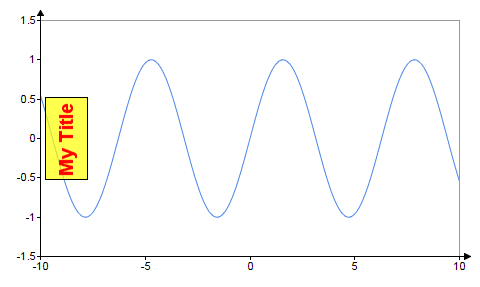
For example, in this chart, the title location is MiddleLeft and Angle is set to 90, Border is ON, and Background is ON.
| You can adjust the background opacity to get the desired contrast between the title and plot area background colors. |