Chart and Plot Area
The PTC Mathcad Chart application displays the chart in the graphics area.
A chart is composed of two areas:
• A chart area
• A plot area
Background and Border
You can customize the chart by clicking the
Chart icon

, and then click the
Styles tab.
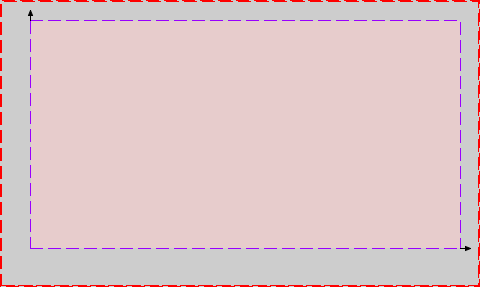
For example, to differentiate between the chart area and the plot area:
• Set the chart area background to gray, and its border to a thick dashed red line
• Set the plot area background to pink, and its border to a thin dashed purple line
The chart is displayed in the graphics area: