Sessions Page
The Sessions page provides information about the number of sessions, session duration, and the type of session exits for users over a specific period.
You can access the Sessions page from the dashboard by using either of the following methods:
• From the Go to page list, select Sessions.
• From the SESSIONS gadget, click SESSIONS.
Use Add Filter to filter session data over a selected period in your environment.
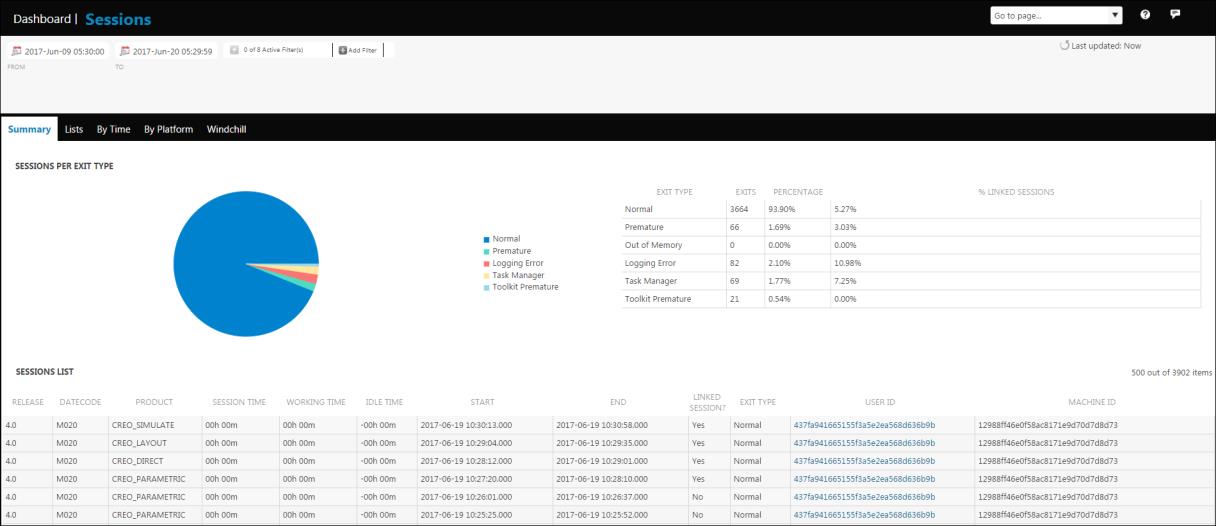
The Summary tab provides a graphical representation of the percentage of sessions for each exit type. This includes the following types of exits:
• Normal
• Premature
• Out of Memory
• Task Manager
• Toolkit Premature
The percentage of sessions that were linked to Windchill during the exit is also listed.
In the SESSIONS LIST table you can find the details of the Creo applications, their releases and datecodes used on the machine. You can also see if a session was linked to Windchill.
The details of Creo sessions used on this machine and the ID of the user who worked on each session are also available. Click a USER ID to open a specific User Page. You can use the links on this page to access additional details for each user.
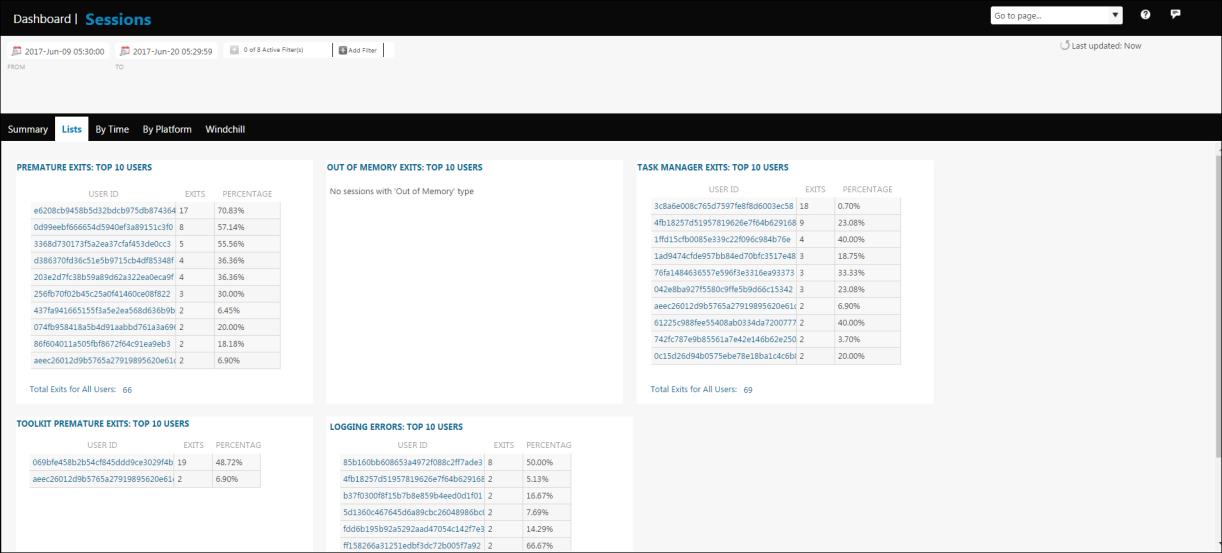
The Lists tab contains information on the top 10 users with unexpected exits for each exit type. This includes the following types of exits:
• Premature
• Out of Memory
• Task Manager
• Toolkit Premature
The following information is available in the tables for each exit type:
• USER ID: The ID of the user. Click a USER ID to open a specific User Page. You can use the links on this page to access additional details for each user.
• EXITS: The number of exit type for this USER ID.
• PERCENTAGE: Percentage of unexpected exits for each USER ID. For example, if a user has a total of 11 unexpected exits and 5 are premature exits, then the PERCENTAGE of premature exits is 45.45 %.
Each table also provides the total number of exits per exit type for all users.
The By Time tab provides a tabular representation of the type of exits over a period of time during a day.
It also provides two graphs that show the number of normal and unexpected exits during a day respectively. Place the pointer on different points on the graphs to view values of the normal and unexpected exits.
A normalized bar graph gives you a comparison between the normal exits and unexpected exits. Place the pointer on different points on the graphs to view the percentage of normal or unexpected exits.
The By Platform tab provides a tabular representation of the number of hosts, the number of unexpected exits, and the total number of sessions for all the machines that run on a particular platform.
It also provides a graphical representation of the number of unexpected exit types for different platforms. Place the pointer on different parts of the graphs to view the percentage of unexpected exits on different platforms.
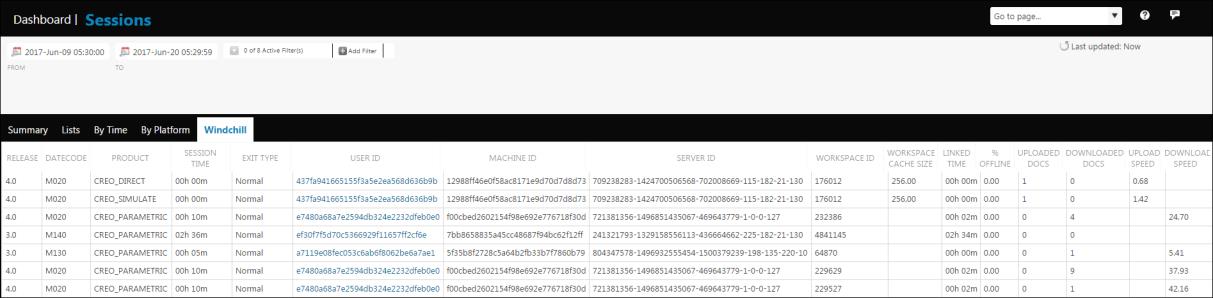
The Windchill tab provides information about all the Creo sessions that were connected to Windchill. For every session, details of the Creo releases and datecodes, user and machine ID, and Windchill are listed. The Windchill-related information includes:
• SERVER ID—ID of the Windchill server which is connected to the Creo application.
• WORKSPACE ID—ID of the Windchill workspace which is connected to the Windchill server.
• WORKSPACE CACHE SIZE—Size of cache for a Windchill workspace. The cache size is specified in MB.
• LINKED TIME—Length of time the Creo application was connected to the Windchill server.
• % OFFLINE—Percentage of time for which the user worked offline.
• UPLOADED DOCS—Total number of documents uploaded from the workspace.
• DOWNLOADED DOCS—Total number of documents downloaded to the workspace.
• UPLOAD SPEED—Average speed of document upload from the Windchill workspace in the session.
• DOWNLOAD SPEED—Average speed of document download to the Windchill workspace in the session.
Click a USER ID to open a specific User Page. The Workspaces tab provides details about all the workspaces owned by the user.