Session Counts
Description
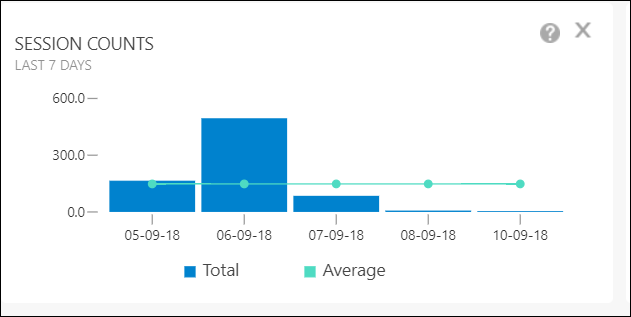
The Session Counts gadget displays a bar graph depicting the total number of sessions per day, with a line plot overlay showing the average number of sessions for 1, 7, 14, 21, or 28 days. When comparing the average session count to the count for a particular day you can detect outliers which may indicate heavy usage or potential problems. For example, an above-average session count on a day may be the result of a repetitive, reproducible, and unexpected exit. The cause for reproducible exits can usually be diagnosed and fixed.
To configure a different time period for the Session Counts gadget:
1. Click  to remove the existing Sessions Count gadget.
to remove the existing Sessions Count gadget.2. Click Add Gadgets and select the Adoption tab.
3. Select the period and click Add.