Understanding Fatigue Analysis
This document provides background information on fatigue and describes the methodology used in Creo Simulate fatigue analysis. It covers the following topics:
• Strain Cycles
Includes the effect of mean residual stresses, hysteresis loop capture and rainflow cycle counting.
• Factors that Affect Fatigue Life
Includes Component Size, Loading Type, Surface Finish, Surface Treatment (that is, Mechanical Treatments, Plating, and Thermal Treatments), and Effect of Surface Treatments on Endurance Limit.
The solver technology integrated with Creo Simulate fatigue analysis is provided by nCode International. Fatigue analysis requires a Fatigue Advisor license from PTC.
History of Fatigue
The majority of component designs involve parts subjected to fluctuating or cyclic loads. Such loading induces fluctuating or cyclic stresses that often result in failure by fatigue. About 95% of all structural failures occur through a fatigue mechanism.
The damage done during the fatigue process is cumulative and generally unrecoverable, due to the following:
• It is nearly impossible to detect any progressive changes in material behavior during the fatigue process, so failures often occur without warning.
• Periods of rest, with the fatigue stress removed, do not lead to any measurable healing or recovery.
It was well-known that wood or metal could be made to break by repeatedly bending it back and forth with a large amplitude. But, it was then discovered that repeated stressing can produce fracture even when the stress amplitude is apparently well within the elastic range of the material. When fatigue failures of railway axles became a widespread problem in the middle of the nineteenth century, this drew attention to cyclic loading effects. This was the first time that many similar components had been subjected to millions of cycles at stress levels well below the monotonic tensile yield stress. Between 1852 and 1870 the German railway engineer August Wöhler set up and conducted the first systematic fatigue investigation.
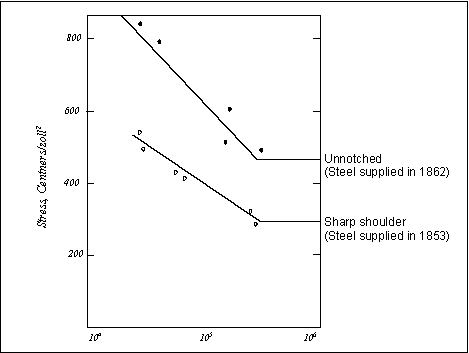
Some of Wöhler's data are for Krupp axle steel and are plotted, in terms of nominal stress (S) vs. number of cycles to failure (N), on what has become known as the S-N diagram. Each curve on such a diagram is still referred to as a Wöhler line.
Note: 1centner = 50 kg, 1 zoll = 1 inch, 1 centner/zoll2 ~ 0.75 MPa
At about the same time, other engineers began to concern themselves with problems of failures associated with fluctuating loads in bridges, marine equipment, and power generation machines. During the first part of the twentieth century, more effort was placed on understanding the mechanisms of the fatigue process rather than just observing its results. This activity finally led, in the late fifties and early sixties, to the development of the two approaches, one based on linear elastic fracture mechanics, LEFM, to explain how cracks propagate, and the so-called Coffin-Manson local strain methodology to explain crack initiation. Through this understanding, modern designers and engineers have been able to create more fatigue-resistant components without relying solely on experimentation. From a practical point of view, this has been a much more profitable approach.
Physics of Fatigue
Since 1830, it has been recognized that metal under a repetitive or fluctuating load will fail at a stress level lower than required to cause failure under a single application of the same load.
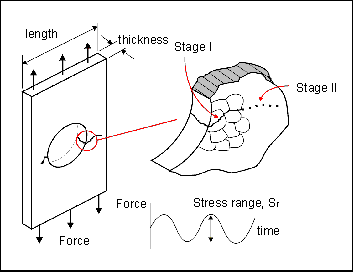
The following diagram shows a simple component subjected to a uniform sinusoidally varying force. After a period of time, a crack can be seen to initiate on the circumference of the hole. This crack will then propagate through the component until the remaining intact section is incapable of sustaining the imposed stresses and the component fails.
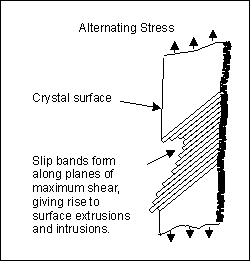
The physical development of a crack is generally divided into 2 separate stages. These relate to the crack initiation phase (Stage I) and the crack growth phase (Stage II). Fatigue cracks initiate through the release of shear strain energy. The following diagram shows how the shear stresses result in local plastic deformation along slip planes. As the loading is cycled sinusoidally, the slip planes move back and forth like a pack of cards, resulting in small extrusions and intrusions on the crystal surface. These surface disturbances are approximately 1 to 10 microns in height and constitute embryonic cracks.
A crack initiates in this way until it reaches the grain boundary. At this point the mechanism is gradually transferred to the adjacent grain
When the crack has grown through approximately 3 grains, it is seen to change its direction of propagation. Stage I growth follows the direction of the maximum shear plane, or 45° to the direction of loading. During Stage II the physical mechanism for fatigue changes. The crack is now sufficiently large to form a geometrical stress concentration. A tensile plastic zone is created at the crack tip as shown in the following diagram. After this stage, the crack propagates perpendicular to the direction of the applied load.
As the physical mechanism for fatigue is divided into two stages, the methods of analysis are also conventionally divided into two stages. Stage I is typically analyzed using the local strain (or E-N) approach, while Stage II is analyzed using a fracture mechanics based approach.
A complete fatigue prediction could therefore use a combination of both methods:
Total Life = Life to initiation + Life taken to propagate crack to failure
However, most engineering components spend most of their time at either one stage or the other. In this case, it is normal to conservatively consider only one stage. For example, in most ground vehicle designs, life is typically governed by time to initiation. Components are relatively stiff and the materials fairly brittle. Once the crack has initiated, it takes a relatively short time to propagate to failure.
By contrast, many aerospace applications use flexible components made of very ductile materials. In this case, cracks propagate relatively slowly and so the fracture mechanics approaches are usually more appropriate.
The physical nature of fatigue was not widely understood during the early days. August Wöhler therefore took a more pragmatic view of fatigue analysis. The method he developed later became known as nominal stress (or S-N) fatigue analysis. This did not differentiate between the Stage I and II growth methods and instead related the nominal stress range to the time taken to complete failure.
Though S-N analysis is still widely used in test-based fatigue analysis, it has one major drawback for CAE applications. Fatigue initiation is driven by local plastic strains, but S-N analysis uses elastic stress as the input. Therefore, S-N analysis is unsuitable for performing CAE analysis on components containing local areas of plasticity. For this reason local strain (or E-N) methods are more universally suitable. Creo Simulate fatigue analysis uses the E-N method.
The E-N Approach
In a fatigue test, hourglass-shaped specimens of different material types are subjected to various types of cyclic loading, such as: small-scale bending, torsion, tension, and compression. The E-N approach uses these tests to measure fatigue life. The results are plotted in terms of strain (E) vs. cycles to failure (N) on an E-N diagram. A typical E-N diagram is illustrated below for a low alloy steel and an aluminum alloy.
Creo Simulate uses a generic set of fatigue properties to model low alloy steels, unalloyed steels, aluminum alloys, and titanium alloys. These generic properties have been compiled by Baumel Jr. and Seeger and are known as the Uniform Material Law. While they cannot be expected to give accurate fatigue lives for practical purposes, they are ideal for determining whether a component is likely to suffer from fatigue problems, and whether a more detailed analysis is needed before commissioning. For more information on the Uniform Material Law, see
Materials Science Monographs, 61, "Materials Data for Cyclic Loading, Supplement 1." The following discussion covers two aspects of fatigue theory that are critical to an understanding of the how Fatigue Advisor measures fatigue:
Strain Cycles
Before looking in more detail at the E-N procedure, it helps to understand the three different types of cyclic strains that contribute to the fatigue process. The following diagrams and descriptions explain each separate type.
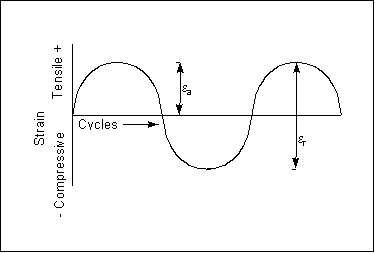
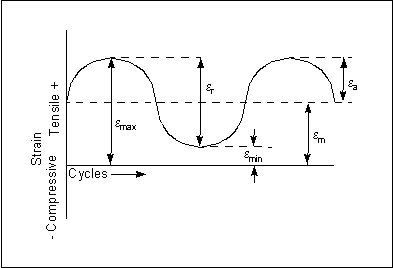
The first figure illustrates a fully-reversed strain cycle with a sinusoidal form. This is an idealized loading condition typically found in rotating shafts operating at constant speed without overloads. This is also the type of strain cycle used for most fatigue tests. For this kind of cycle, the maximum (
 max
max) and minimum (
 min
min) strains are of equal magnitude but opposite sign. Usually tensile strain is considered to be positive and compressive strain negative. The strain range,
 r
r, is the algebraic difference between the maximum and minimum strains in a cycle.
The strain amplitude,
 a
a, is one half the strain range.
 a
a =
 r/2
r/2 = (
 max
max –
 max
max) / 2
The second figure illustrates the more general situation where the maximum and minimum strains are not equal. In this case, they are both tensile and define a mean offset,
 m
m = (
 max
max +
 min
min) / 2, for the cyclic loading.
As mentioned above, most basic fatigue data are collected using fully-reversed loads. Therefore, these data are not directly applicable for strain cycles with a non-zero mean (
 m
m
0). In order to predict more realistic life estimates for strain cycles with tensile or compressive mean stress, results of the tests conducted using fully-reversed loads are corrected. The choice of corrective approach to use depends on whether the mean stress is primarily tensile or compressive.
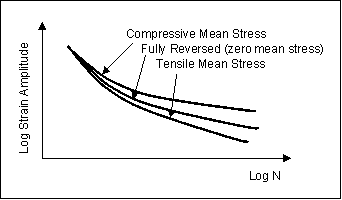
The reason for this can be seen in the following plot which schematically illustrates the effect of mean stress on the strain-life (E-N) curve. Viewed conceptually, tensile mean stress acts to pull open a crack while compressive mean stress works to keep it closed. Typically the effects are concentrated at the long life end of the diagram, with tensile mean stress reducing life and compressive mean stress extending it.
Since the tests required to calculate E-N curves for a range of mean stresses are quite expensive, several empirical relationships have been developed to model the effect of mean stress. Of all the proposed methods, two have been most widely accepted:
• The Smith, Watson, Topper Approach
• The Morrow Correction
For loading sequences which are predominantly tensile in nature, the Smith, Watson, Topper approach is more conservative and is therefore recommended. In the case where the loading is predominantly compressive, particularly for wholly compressive cycles, the Morrow correction can be used to provide more realistic life estimates.
Creo Simulate uses both methods and the most appropriate method is automatically chosen. For more information on the Smith, Watson, Topper approach, see
"A Stress-Strain Function for the Fatigue of Metals", Journal of Materials, Vol. 5, No. 4, 1970. For more information on the Morrow correction, see
"Fatigue Design Handbook", Advances in Engineering, Vol. 4, Society of Automotive Engineers, 1968.
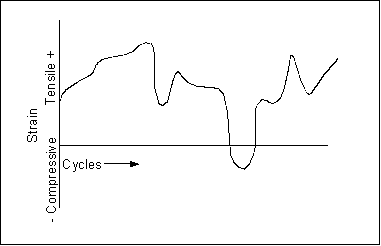
The next figure illustrates a more complex, variable amplitude loading pattern that is closer to the cyclic strains found in real structures.
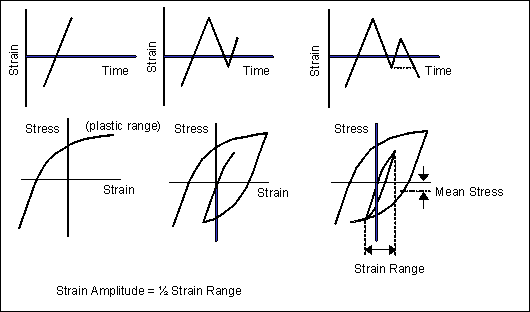
For variable amplitude loading it is necessary to extract the fatigue damaging cycles from the signal and then evaluate the damage carried out by each cycle. The total damage is the sum of the damage caused by each individual cycle. Each fatigue cycle is extracted by a process known as hysteresis loop capture. The loci of the stress and strain are plotted as shown in the following diagram.
When a stress-strain hysteresis loop is closed, then the strain range and mean stress are returned and the damage calculated using the E-N curve modified for mean stress correction. This analysis is carried out over the whole strain time signal until all the cycles have been extracted and the total damage evaluated. A very efficient algorithm has been developed to perform cycle extraction known as: Rainflow Cycle Counting. This is the algorithm that Creo Simulate uses.
Creo Simulate normally uses a linear elastic solution to determine the pseudo-elastic strains in a component. In other words, the solution ignores plasticity. Before proceeding with the fatigue analysis, these strains are automatically converted into non-linear elastic-plastic strains using Neuber's relationship.
Factors that Affect Fatigue Life
As mentioned above, the E-N curve is derived from strain control tests based on hourglass-shaped specimens.
A standardized, fully reversed fatigue test is used to determine a base-line E-N relationship for a polished specimen, approximately 6 mm in diameter. While the fatigue or endurance limit measured in this test is denoted by

'
e, a component in service has lower limit,
 e
e, that reflects modifications to a specimen outside of the laboratory. For steels in particular, several empirical relationships account for the variation in
 e
e as a result of the following:
• Component size, Csize
• The type of loading, Cload
• The effect of notches, Cnotch
• The effect of surface finish, Csur < 1 (promotes crack growth)
• The effect of surface treatment, Csur >1 (inhibits crack growth)
To account for these effects, specific modifying factors are typically applied to the test result so that:

e =
 'e
'eC
notchC
sizeC
loadC
sur......
where reciprocal of the product,CnotchCsizeCloadCsur , is collectively known as the failure strength reduction factor Kf:
Kf = 1 / (CnotchCsizeCloadCsur......)
It is very important to remember that all the modification factors are empirical, conservative and generally only applicable to steel. They provide little or no fundamental insight into the fatigue process itself other than providing approximate trends. In particular they should not be used in areas outside their measured applicability.
Read the following to learn more about the factors that influence fatigue life:
The Influence of Component Size
Fatigue in metals results from the nucleation and subsequent growth of crack-like flaws under the influence of an alternating stress field. The theory is that failure starts at the weakest link, the most favorably orientated metal crystal for example, and then grows through less favorably orientated grains until final failure. Intuitively, it would seem reasonable to suppose that the larger the volume of material subjected to the alternating stress, the higher the probability of finding the weakest link sooner. Actual test data do confirm the presence of a size effect particularly in the case of bending and torsion.
The stress gradient built up through the section, in bending and to a lesser extent in torsion, concentrates more than 95% of the maximum surface stress in a thin layer of surface material. In large sections, this stress gradient is less steep than in smaller sections. So the volume of material available that could contain a critical flaw will be greater, leading to a reduced fatigue strength. The effect is small for axial tension where the stress gradient is absent. The value for Csize is estimated from one of the following.
If the diameter of the test specimen shaft is d < 6 mm:
Csize = 1
If the diameter of the test specimen shaft is 6 mm < d < 250 mm
Csize = 1.189d-0.097
The effect of size is particularly important for the analysis of rotating shafts such as might be found in vehicle powertrains.
For situations where components do not have a round cross section, the following equation calculates an equivalent diameter, deq, for a rectangular section under bending with width (w) and thickness (t):
deq2 = 0.65wt
The Influence of Loading Type
Fatigue data measured using one type of cyclic loading, axial tension for example, may be "corrected" to represent the data that would have been obtained had the test been performed using some other loading methodology such as torsion or bending. The standardized rotating bend test calls for tests to be carried out under conditions of fully reversed bending.
In moving from one loading condition to another, the values of C load to be used with the endurance limit,
 e
e are detailed below:
Measured Loading | | Target Loading | C load |
Axial | to | Bending | 1.25 |
Axial | to | Torsion | 0.725 |
Bending | to | Torsion | 0.58 |
Bending | to | Axial | 0.8 |
Torsion | to | Axial | 1.38 |
Torsion | to | Bending | 1.72 |
Thus, using the values from this table, if an axial tension load produces a strain of
 e
e, the strain produced under a bending load would be 1.25
 e
e.
In addition to influencing the endurance limit, loading conditions can also influence the Basquin slope, b, which is used when plotting the E-N curve on log-log scale. This effect is usually taken into account by modification of the strain at 10
3 cycles,
 3
3, as well as
 e
e. The following factors are used to define C'load, the
 3
3 modification factor:
MeasuredLoading | | Target Loading | C' load |
Axial | to | Torsion | 0.82 |
Bending | to | Torsion | 0.82 |
Torsion | to | Axial | 1.22 |
Torsion | to | Bending | 1.22 |
The Influence of Surface Finish
A very high proportion of all fatigue failures nucleate at the surface of components so that surface conditions become an extremely important factor influencing fatigue strength. Various surface conditions are usually judged against the polished laboratory specimen standard. Normally, scratches, pits, machining marks, and so forth, influence fatigue strength by providing additional stress raisers that aid the process of crack nucleation.
The diagram below shows that high strength steels are more adversely affected by a rough surface finish than softer steels. For this reason, the surface finish correction factor, Csur < 1, is strongly related to tensile strength. Here the surface finish correction factor categorizes finish in qualitative terms such as polished, machined, and forged.
Note that some of the curves presented in this figure include effects other than just surface finish. For example, the forged and hot rolled curves include the effect of decarburization.
Other diagrams present the surface finish correction factor in a more quantitative way by using a quantitative measure of surface roughness such as RA (the root mean square) or AA (the arithmetic average). The following diagram shows the effect of surface roughness on the surface finish correction factor.
Values of surface roughness associated with each of the manufacturing processes are readily available in handbooks, as in the example below:
Type of Finish(Microns) | Surface Roughness |
Lathe-formed | 2.67 |
Partly hand polished | 0.15 |
Hand Polished | 0.13 |
Ground | 0.18 |
Superfinished | 0.18 |
Ground and polished | 0.05 |
The Qualitative Influence of Surface Treatment
As in the case of surface finish, surface treatment can greatly influence fatigue strength, particularly the endurance limit. The net effect of the treatment is to alter the state of residual stress at the free surface.
Residual stresses arise when plastic deformation is not uniformly distributed throughout the entire cross section of the component being deformed. In the preceding figures, a metal bar has a surface that is being deformed in tension by bending.
• At time T=1, bending moment M1 is being applied and is in the elastic range.
• At time T=2, the bending moment has increased to M2, the yield stress (Sy) has been reached, and the surface undergoes plastic deformation.
• When the external force is removed, the regions that were plastically deformed prevent the adjacent elastic regions from complete elastic recovery to the unstrained condition. In this way, the elastically deformed regions are left in residual tension, and the plastically deformed regions are in a state of residual compression. The result is the stress distribution at time T=3.
For many purposes, residual stress can be considered identical to the stresses produced by an external force. Thus, the presence of a compressive residual stress at the surface of a component will effectively decrease the probability of fatigue failure.
The preceding figure illustrates the superposition of applied and residual stresses.
• The top schematic shows an elastic stress distribution in a beam under bending moment M with no residual stress.
• In the center schematic, a typical residual stress distribution associated with a mechanical surface treatment such as shot peening is detailed. Note that the compressive stress at the surface is compensated by an equivalent tensile stress over the interior of the cross section.
• In the bottom schematic, the distribution due to the algebraic summation of the applied stress (caused by bending moment M) and residual stress is shown. Note that the maximum tensile stress at the surface has been reduced by the amount of the residual stress. Also, the peak tensile stress has now been moved to the interior of the beam. The magnitude of this stress will depend on the gradient of the applied stress and the residual stress distribution. Under these conditions, subsurface crack initiation becomes a possibility.
Surface treatments are divided broadly into mechanical, thermal, and plating processes. The first two processes provide a compressive layer. The plating process provides a tensile residual stress. Following is detailed description of each process:
• Mechanical Treatments — The main commercial methods for introducing residual compressive stresses are cold rolling and shot peening. Although some alteration in the strength of the material occurs as a result of work hardening, the improvement in fatigue strength is due mainly to the compressive surface stress. Surface rolling is particularly suited to large parts and is frequently used in critical components such as crankshafts and the bearing surface of railway axles. Bolts with rolled threads typically possess twice the fatigue strength of conventionally machined threads.
Shot peening, which consists of firing fine steel or cast iron shot against the surface of a component, is particularly well suited to processing small mass produced parts.
It is important to remember that cold rolling and shot peening have their greatest effect at long lives. At short lives they have little or no effect.
As with other modifying factors, correction factors can be used to account for the effect of these mechanically induced compressive stresses by adjusting the endurance limit
 e
e. Typically the factor associated with peening is about 1.5 to 2.0.
• Thermal Treatments — Thermal treatments are processes that rely on the diffusion of either carbon (carburizing) or nitrogen (nitriding) onto and into the surface of a steel component. Both types of atoms are interstitial, that is they occupy the spaces between adjacent iron atoms, thereby increasing the strength of the steel and causing a compressive residual stress to be left on the surface through volumetric changes.
Carburizing is typically a three-step process:
◦ packing the steel components within boxes which contain carbonaceous solids
◦ sealing to exclude the atmosphere
◦ heating to about 900 degrees Celsius for a period of time that depends on the depth of the case required
Alternatively components may be heated in a furnace in the presence of a hot carburizing gas such as natural gas. This process has the advantage that it is quicker and more accurate. In addition, the carburizing cycle may be followed up by a diffusion cycle with no carburizing agent present. This allows some of the carbon atoms to diffuse further into the component and thus reduces gradients.
The nitriding process is very similar in nature to gas carburizing except that ammonia gas is used and the components are soaked at lower temperatures. Typically 48 hours at about 550 degrees Celsius will provide a nitrided case depth of about 0.5 mm. Nitriding is particularly suited to the treatment of finished notched components such as gears and slotted shafts. The effectiveness of the process is illustrated in the following table:
| Endurance Limit (MPa) |
Geometry | Not Nitrided | Nitrided |
Un-notched | 310 | 620 |
Semicircular notch | 175 | 600 |
V notch | 175 | 550 |
• Plating — Chrome and nickel plating of steel components can decrease the endurance limit by more than half, due to the creation of tensile residual stresses at the surface. These tensile stresses are a direct result of the plating process itself. As in the case of mechanically induced surface stresses, the effect of plating is most pronounced at the long life end of the spectrum and also with higher strength materials.
Introducing a compressive residual stress prior to the plating process such as shot peening or nitriding can reduce the harmful effects of plating. Annealing components after plating, thereby relieving the tensions, is an alternative approach.
The Quantitative Effect of Surface Treatments on the Endurance Limit (Steels)
The effect of surface treatment depends on the surface finish. The increase in endurance limit stress due to the surface treatment is given in the following table:
| Increase in Endurance Limit |
Finish | Shot Peened | Cold Rolled | Nitrided |
Polished | +15% | +50% | +100% |
Ground | +20% | +0% | +100% |
Machined | +30% | +70% | +100% |
Hot Rolled | +40% | +0% | +100% |
Cast | +40% | +0% | +100% |
Forged | +100% | +0% | +100% |
Whatever correction was made by the surface finish, applying a surface treatment will have a subsequent effect based on the preceding table. For example, if machining reduces the endurance limit by 30%, then from the table it can be seen that cold rolling will recover the loss by increasing the limit 70%.



 max) and minimum (
 min) strains are of equal magnitude but opposite sign. Usually tensile strain is considered to be positive and compressive strain negative. The strain range,
  r, is the algebraic difference between the maximum and minimum strains in a cycle.
 r =
r =  max–
max–  min
min a, is one half the strain range.
 a =
a =  r/2 = (
 max –
max –  max) / 2
 m = (
m = ( max +
max +  min) / 2, for the cyclic loading.
 m
m 0). In order to predict more realistic life estimates for strain cycles with tensile or compressive mean stress, results of the tests conducted using fully-reversed loads are corrected. The choice of corrective approach to use depends on whether the mean stress is primarily tensile or compressive.
 'e, a component in service has lower limit,
  e, that reflects modifications to a specimen outside of the laboratory. For steels in particular, several empirical relationships account for the variation in
  e as a result of the following:
 e =
e =  'eCnotchCsizeCloadCsur......
 e are detailed below:
 e, the strain produced under a bending load would be 1.25
 e.
e. 3, as well as
  e. The following factors are used to define C'load, the
  3 modification factor:


 e. Typically the factor associated with peening is about 1.5 to 2.0.