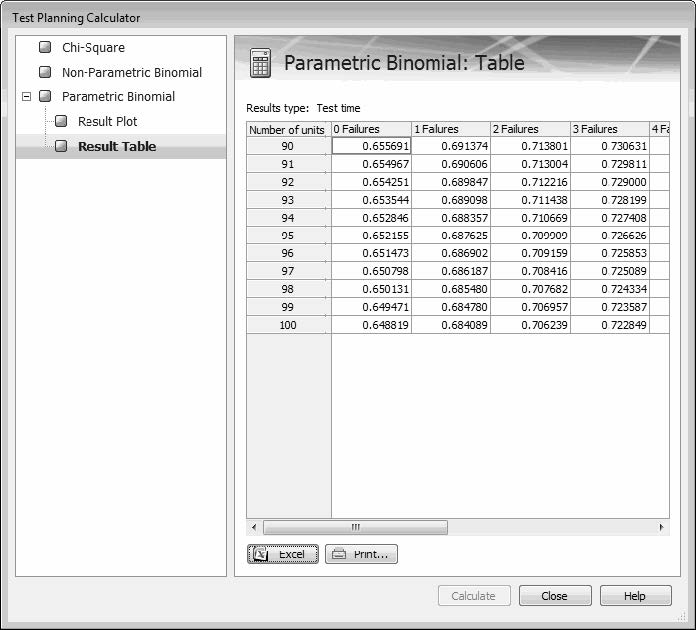
Result Table
In the navigation pane of the Test Planning Calculator, you click Parametric Binomial to expand the entries under this heading. To later collapse this heading, you click the minus sign (-) that then appears to its left. When the Parametric heading is expanded, clicking Result Table displays the results calculated for either test time or test units. For more information, see Using the Parametric Binomial Distribution to Compute Test Time or Units.
As described in Parametric Binomial Distribution Options, the values that are specified under Plot and table options prior to clicking Calculate are used to generate these results.
• When Test time is selected for Solve for, the table shows the amount of test time that is required to reach a certain number of failures when testing with a known number of units. In this case, the first column is Number of units.
• When Test units is selected for Solve for, the table shows the number of units required during testing to reach a certain number of failures when testing for a known amount of time. In this case, the first column is Test time.
Columns 2 through N of the table display the results for each number of failures. The column names are: # Failures, where # is an integer representing the number of failures.
At the bottom of the Results Table page are Excel and Print buttons, which you can use to save table results to a Microsoft Excel spreadsheet or to print them to a printer. For more information, see Excel and Print Buttons.
