Options for Multiple Weibull Plots
As indicated in Weibull Plot Options, the selection that you make for Number of plots controls the other options shown in the Weibull Plot Options pane. The following table describes the options that appear when Multiple is selected. Once the data set is calculated, you can view the multiple plots generated in the Weibull Plot pane. For more information, see Weibull Plots.
|
Option
|
Description
|
||
|---|---|---|---|
|
Number of plots
|
Indicates whether to generate one plot or multiple plots. This topic assumes that Multiple is selected.
|
||
|
Vary plots by
|
The way by which multiple plots are to differ. Choices are Distribution and Plot Type. This option is shown for all but non-parametric life data sets, where multiple plots vary only by plot type. When Competing Failure Modes is the model selected for a parametric life data, plots can vary only by type. For more information, see Competing Failure Modes. Descriptions of all possible plots appear in Plot Types.
• When Distribution is selected (default), Plot type becomes available and the Distribution area is shown at the bottom of the pane. For Plot type, you select the plot to generate for multiple distributions. In the Distribution area, you select the distributions to plot.
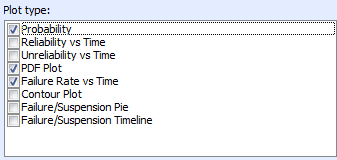
• When Plot Type is selected, the Plot type area is shown at the bottom of the pane. In this area, you select the plots to display.
|
||
|
Plot type
|
When plots are to vary by distribution, this option provides a choice list for choosing the type of plot to generate for each distribution selected.
|
||
|
Distribution
|
When plots are to vary by distribution, checkboxes are present for all distributions supported for the data set. You select the checkboxes for the ones to plot.  |
||
|
Plot type
|
When plots are to vary by plot type, checkboxes are available for the plots supported for the data set. You select the checkboxes for the ones to plot.  |