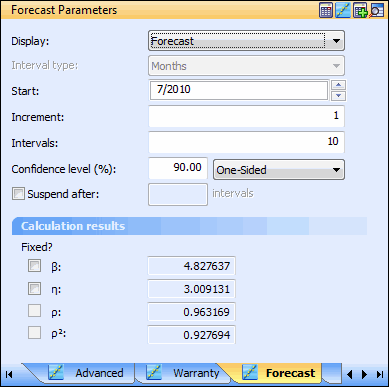
Forecast Parameters Pane for a Warranty Data Set
When a warranty data set is selected in the LDA Navigator, you supply forecast parameters in the Forecast Parameters pane. The objective is to forecast or predict the number of items returned under warranty for some number of specified time units or intervals.

The following table describes all of the parameters that can appear in the Forecast Parameters pane. The selections you make in this pane affect the calculated results shown in the Weibull Forecast pane, which is described in Weibull Forecast Pane for a Warranty Data Set.
Parameter | Description |
|---|---|
Display | Specifies how to configure the table shown in the Weibull Forecast pane. Choices are Forecast, Upper Bounds, Lower Bounds, and Summary. The default is Forecast. • When Forecast, Upper Bounds, or Lower Bounds is selected, in the table, a row exists for each sales interval, plus a row with totals is present at the bottom. Additionally, columns exist for each forecast interval. Depending on your selection for this field, the values shown in table cells are either the forecasted number of returns, upper bounds, or the lower bounds for the forecast interval. • When Summary is selected, in the table, a row exists for each forecast interval. Additionally, three columns exist: Upper Bound, Failure Forecast, and Lower Bound. The values shown in table cells are the total values from the Forecast, Upper Bounds, and Lower Bounds tables generated by the other options. |
Interval type | The time units by which to organize sales forecast data in the Weibull Forecast pane. • For the sales vs. returns data format, this field is display-only and for informational purposes. You specify the units by which to organize all sales and return data when you insert or reconfigure the data set. For more information, see Warranty Analysis How-Tos. • For other data formats, you choose the units by which to organize sales forecast data here. Choices are Years, Months, Weeks, and Days. The default is Years. |
Start | The starting point for recording sales forecast data. For the sales vs. returns format, the default is determined when the warranty data set is inserted or reconfigured. For more information, see Warranty Analysis How-Tos. For the other data formats, the default depends on the selection for Interval type. For example, if Years is selected, the default is the first day of the current year. If Months is selected, the default is the first day of the current month. |
Increment | The integer value that represents the step size to take between periods for recording sales forecast data. The default is 1, which means that the recording period, depending on the interval type, is every year, month, week, day, or consecutive number. For example, if Months is selected as the interval type, to record data every three months (quarterly), you enter 3 as the increment value. |
Confidence level (%) | The percentage value to use to calculate the confidence bounds. The default is 90. The parameter to the right provides for indicating whether to use a one-sided or two-sided bounds. Information about confidence types and bounds appears in Confidence Types. |
Suspend after | Indicates whether to end forecast calculations for units that survive or remain in operation after reaching some specified number of intervals, which is typically referred to as the warranty length, because the manufacturer does not accept returns after the expiration of this time period. The units for this interval value is specified by Interval type. |
Calculation results The parameters that can be calculated or specified for each distribution/model combination differ. Calculated results appear in this area only after the data set has been calculated. To use a specific value for a parameter, you select Fixed? and then enter the value. For more information, see Models Per Distribution. | |