Item Failure Rates
Determine a base failure rate for each generic part type by referring to the relevant tables in Data Tables. For items in an operational mode (Figure 3-3), also determine an environmental factor appropriate to the operational environment. Calculate the failure rate contribution of each generic part type by multiplying the quantity (N) by the base failure rate (λb or λB) and the environmental factor (KE) when the item is in the operational mode. Sum the failure rates to provide:
• The predicted failure rate for an item in the non-operational mode, i.e., ΣΝλb. Determine the non-operational environmental factor (KE) for the particular environment from Table 3-2 and multiply by the base failure rate to obtain the predicted non-operational failure rate for the item, i.e., KEΣΝλb. (See Figure 3–2

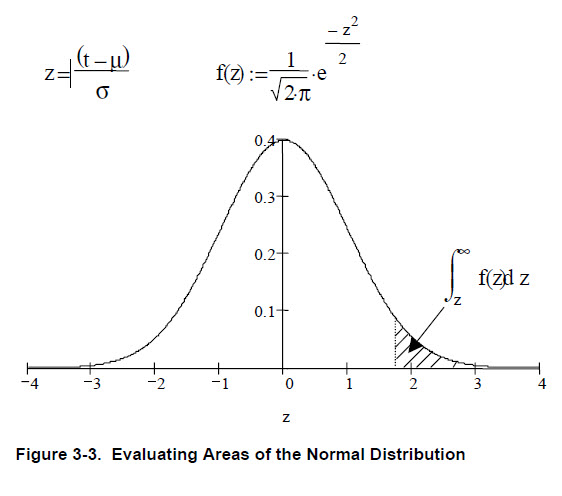
 | .00 | .01 | .02 | .03 | .04 | .05 | .06 | .07 | .08 | .09 | ||
0.0 | .5000 | .4920 | .4920 | .4880 | .4840 | .4801 | .4761 | .4721 | .4681 | .4641 | ||
0.1 | .4602 | .4562 | .4522 | .4483 | .4443 | .4404 | .4364 | .4325 | .4286 | .4247 | ||
0.2 | .4207 | .4168 | .4129 | .4090 | .4052 | .4013 | .3974 | .3936 | .3897 | .3859 | ||
0.3 | .3821 | .3783 | .3745 | .3707 | .3669 | .3632 | .3594 | .3557 | .3520 | .3483 | ||
0.4 | .3446 | .3409 | .3372 | .3336 | .3300 | .3264 | .3228 | .3192 | .3156 | .3121 | ||
0.5 | .3085 | .3050 | .3015 | .2981 | .2946 | .2912 | .2877 | .2843 | .2810 | .2776 | ||
0.6 | .2743 | .2709 | .2676 | .2643 | .2611 | .2578 | .2546 | .2514 | .2483 | .2451 | ||
0.7 | .2420 | .2389 | .2358 | .2327 | .2296 | .2266 | .2236 | .2206 | .2177 | .2148 | ||
0.8 | .2119 | .2090 | .2061 | .2033 | .2005 | .1977 | .1949 | .1922 | .1894 | .1867 | ||
0.9 | .1841 | .1814 | .1788 | .1762 | .1736 | .1711 | .1685 | .1660 | .1635 | .1611 | ||
1.0 | .1587 | .1562 | .1539 | .1515 | .1492 | .1469 | .1446 | .1423 | .1401 | .1379 | ||
1.1 | .1357 | .1335 | .1314 | .1292 | .1271 | .1251 | .1230 | .1210 | .1190 | .1170 | ||
1.2 | .1151 | .1131 | .1112 | .1093 | .1075 | .1056 | .1038 | .1020 | .1003 | .0985 | ||
1.3 | .0968 | .0951 | .0934 | .0918 | .0901 | .0885 | .0869 | .0853 | .0838 | .0823 | ||
1.4 | .0808 | .0793 | .0778 | .0764 | .0749 | .0735 | .0721 | .0708 | .0694 | .0681 | ||
1.5 | .0668 | .0655 | .0643 | .0630 | .0618 | .0606 | .0594 | .0582 | .0571 | .0559 | ||
1.6 | .0548 | .0537 | .0526 | .0516 | .0505 | .0495 | .0485 | .0475 | .0465 | .0455 | ||
1.7 | .0446 | .0436 | .0427 | .0418 | .0409 | .0401 | .0392 | .0384 | .0375 | .0367 | ||
1.8 | .0359 | .0351 | .0344 | .0336 | .0329 | .0322 | .0314 | .0307 | .0301 | .0294 | ||
1.9 | .0287 | .0281 | .0274 | .0268 | .0262 | .0256 | .0250 | .0244 | .0239 | .0233 | ||
2.0 | .02275 | .02222 | .02169 | .02118 | .02068 | .02018 | .01970 | .01923 | .01876 | .01831 | ||
2.1 | .01786 | .01743 | .01700 | .01659 | .01618 | .01578 | .01539 | .01500 | .01463 | .01426 | ||
2.2 | .01390 | .01355 | .01321 | .01287 | .01255 | .01222 | .01191 | .01160 | .01130 | .01101 | ||
2.3 | .01072 | .01044 | .01017 | .00990 | .00964 | .00939 | .00914 | .00889 | .00866 | .00842 | ||
2.4 | .00820 | .00798 | .00776 | .00755 | .00734 | .00714 | .00695 | .00676 | .00657 | .00639 | ||
2.5 | .00621 | .00604 | .00587 | .00570 | .00554 | .00539 | .00523 | .00508 | .00494 | .00480 | ||
2.6 | .00466 | .00453 | .00440 | .00427 | .00415 | .00402 | .00391 | .00379 | .00368 | .00357 | ||
2.7 | .00347 | .00336 | .00326 | .00317 | .00307 | .00298 | .00289 | .00280 | .00272 | .00264 | ||
2.8 | .00248 | .00256 | .00240 | .00233 | .00226 | .00219 | .00212 | .00205 | .00199 | .00193 | ||
2.9 | .00187 | .00181 | .00175 | .00169 | .00164 | .00159 | .00154 | .00149 | .00144 | .00139 | ||
3.0 | .00135 |
| ||||||||||
3.1 | .00097 | |||||||||||
3.2 | .00069 | |||||||||||
3.3 | .00048 | |||||||||||
3.4 | .00034 | |||||||||||
3.5 | .00023 | |||||||||||
3.6 | .00016 | |||||||||||
3.7 | .00011 | |||||||||||
3.8 | .00007 | |||||||||||
3.9 | .00005 | |||||||||||
4.0 | .00003 | |||||||||||
Data Tables, should normally be used as the source of failure rate data. When other sources are used, they should be recorded on the worksheets and approved by the contracting authority.