Failure Rate Variation with Time
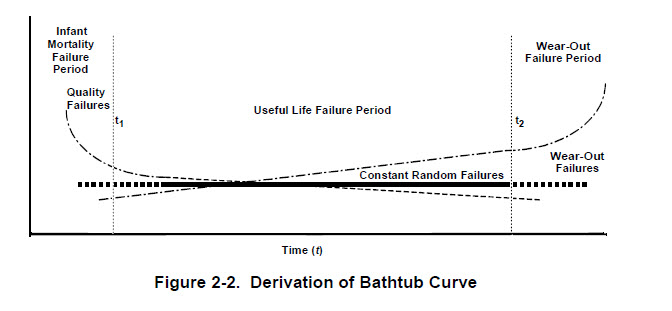
For many items (e.g., non-repairable items or items which when repaired are restored to an as new condition), a generally accepted model for variation of failure rate with time is the familiar bathtub curve shown in Figure 2-1 and Figure 2-2.
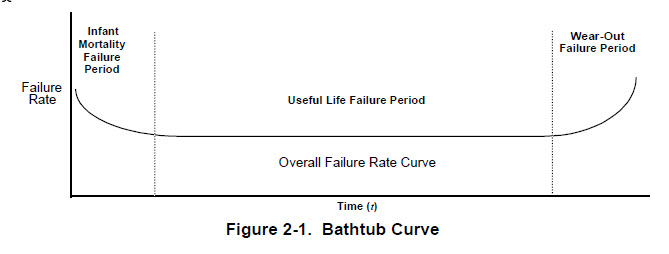
The derivation of the bathtub curve is illustrated below. Initially, failures of an item placed in service are often seen to be dominated by ‘quality’ failures. These failures, which occur in what is known as the ‘infant mortality’ period, fade because they are fixed as they emerge. Later, as the system ‘ages’, the item enters a ‘wear-out’ period. The ‘useful life’ period, where there is often seen to be a ‘constant’ failure rate, lies between the infant mortality and wear-out periods.