Example of a Two-component System
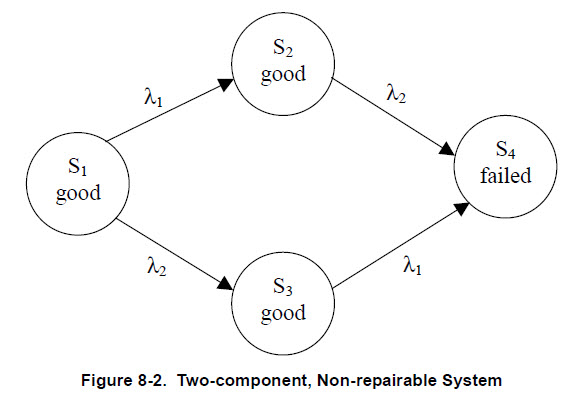
Assume that there are two components in a system (labelled A and B) and that these components are in parallel. Thus, the system will function properly as long as at least one of the two components is good. Also assume that λ1 and λ2 are the failure rates of component A and component B respectively. Therefore, the system has a total of four states (labelled S1, S2, S3 and S4):
• S1–Component A is good, and Component B is good. (The system is good.)
• S2–Component A is good, but Component B has failed. (The system is good.)
• S3–Component B is good, but Component A has failed. (The system is good).
• S4–Component B has failed, and Component A has failed. (The system has failed).
Of the four system states possible, only one, S4, is a failed state. The state transition diagram of this two-component system is shown in Figure 8-2.

Because the two components in this example are assumed to be independent and non-repairable, this problem can be solved using a combinatorial model such as an RBD.
Generally, the arrow representing the initial state is omitted from the diagram because:
• The initial state is generally where all components are in the good condition. In this example, S1 is the initial state.
• Multiple initial states can exist, such as when there are multiple phases of mission. In these cases, all initial states are assigned probabilities that are then represented by an initial state probability vector.
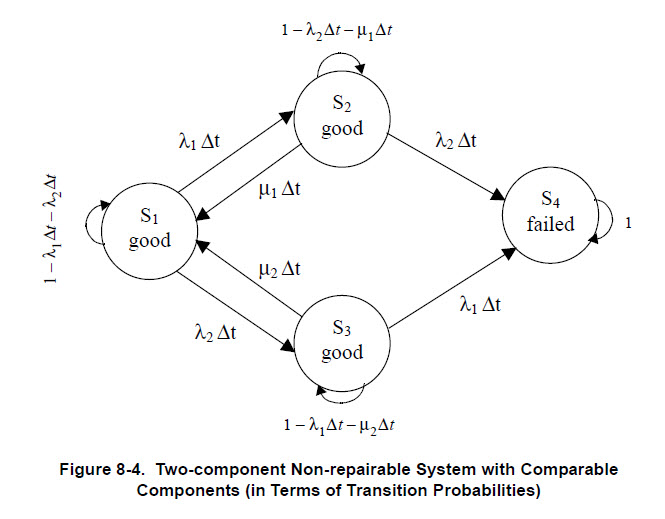
Now, assume that the components can be repaired as long as there is no system failure. This means that failed components can be repaired in state S2 and state S3. Also assume that μ1 and μ2 are the repair rates of component A and component B respectively. Figure 8-3 shows a state transition diagram that can represent this system. This problem cannot be solved using combinatorial models.

In some text books, the state transition diagrams of continuous models are represented using their discrete equivalents. For example, if λ is the transition rate from state i to state j, then the probability of occurrence of that transition within Δt (a small increment of t, is approximately equivalent to λΔt. If there are multiple events that can occur in that state and their summation is λ, then λΔt is equivalent to the probability of transition within Δt. This shows 1–λΔt that is the probability of no transition occurring within Δt. Figure 8-4 shows this state transition diagram.

In all of the examples presented so far, it is assumed that the system state can be expressed as combinations of component states. However, in some cases, the order of the events (failures, for example) are important. Suppose that each of these states has a different effect on system reliability and fail-safety. The probability of component A failing before component B fails and the probability of component B failing before component A fails must then be known. For this example, five system states (labelled S1, S2, S3, S4 and S5) exist.
• S1–Component A is good, and Component B is good. (The system is good.)
• S2–Component A is good, but Component B has failed. (The system is good.)
• S3–Component B is good, but Component A has failed. (The system is good.)
• S4–Component A has failed, and then Component B has subsequently failed. (The system has failed in mode 1.)
• S5–Component B has failed, and then Component A has subsequently failed. (The system has failed in mode 2.)
Figure 8-5 shows a state transition diagram of this system without considering repairs. Problems considering sequence cannot be solved using combinatorial models.

The previous discussion shows that finding all of the system failure states may not always be simple. The following approach to constructing a state transition diagram is recommended:
1. Understand the system and the behaviours that are going to be modelled, drawing each system state in the state transition diagram.
2. Find the initial state of the system (which is generally where all components are in a good condition) and then classify each state (good, failed, etc.).
3. Determine all events that can occur in each state (component failures, repairs, external events such as common cause failures, etc.).
4. For each event that can occur in a state:
a. Find the state that corresponds to the event’s occurrence. If this state already appears in the state transition diagram, then draw a transition from the current (initial) state to the succeeding (next) state. Otherwise, create a new state and then draw the transition.
b. Set the rate for this transition, which is the event occurrence rate (such as a failure rate or repair rate).
c. Classify the state (good, failed, etc.).
5. Repeat steps 3 and 4 for each state. The state transition diagram is completed when all states are visited and there are no states left to create.
After constructing the state transition diagram, adding the following information can be useful.
• Initial condition. Generally the initial condition (state probability) is 1 for the perfect state of the system (which is where this example starts), and 0 for all other states.
• Capacity. The throughput or reward of the system. For additional information, refer to Expected Capacity or Reward.
The following information is also useful for constructing state transition diagrams:
• Results from Failure Mode and Effects Analysis (FMEA) can help to identify all possible failures of a component. For additional information, refer to Failure Mode and Effects Analysis.
• An absorbing state is a state in which no events can occur. Once a system reaches an absorbing state, it cannot visit any other state. Therefore, there are no outward transitions from this state. Generally, all absorbing states are failed states.
• Between one state and another, there can be only one transition. If multiple events make this transition, all transition rates between these two states should be added together and then this value assigned to the transition.
• Similar states are generally merged to reduce the state space and keep the state transition diagrams neat and readable. Any two states having the same transitions going out from them are treated as if they had the same set of succeeding states and corresponding transitions rates.
• All failed and absorbing states can be merged to a single state if there is no interest in analysing individual failures, i.e., when all failed states are of the same type.
• If the sequence in which failures occur is important to identifying the type of state (good, failed, etc.), states should not be merged based on the combination of component failures. Otherwise, states can be merged on this basis.