Color Page
In the Plot Properties window, the Color page provides the style setting for the plot and color settings for various portions of the plot.
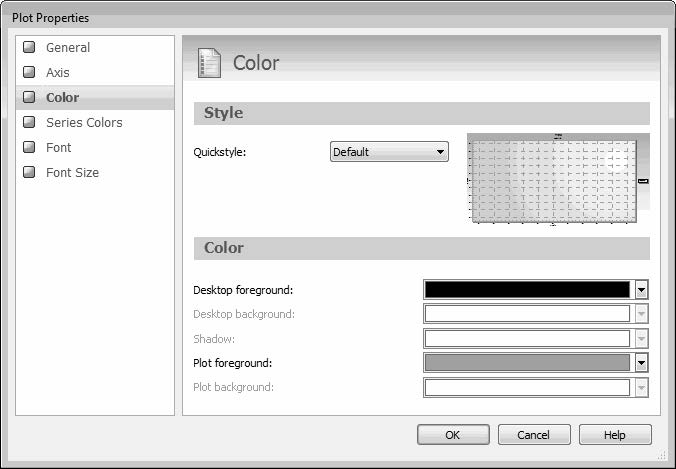
The following table describes the properties available on the Colors page.
Property | Description |
|---|---|
Style The single property under this heading specifies the plot style. The area to the right displays a preview of the plot based on the current selection. When either Default or No Style is selected for Quickstyle, the preview of the plot reflects selections for properties under Color. | |
Quickstyle | The style to use for the plot. In addition to Default, more than a dozen other choices are present, allowing you to change the plot background and/or border style. Selecting No Style removes the background. In this case, the borders around the plot are thin lines. |
Color The properties under this heading specify the colors to use for the plot. Some or all of these properties are available only when Default or No Style is selected for Quickstyle. Clicking the drop-down control to the right of these properties displays the color control. For more information, see Using the Color Control. | |
Desktop foreground | Indicates the color in which to display the title, subtitles, and labels. The default is black. |
Desktop background | Indicates the color in which to display the page area behind the plot. This property is available only when No Style is selected for Quickstyle. |
Shadow | Indicates the color in which to display the dropshadow for the legend. This property is available only when No Style is selected for Quickstyle. The default is gray. For more information, see Weibull Plot Legend. |
Plot foreground | Indicates the color in which to display the grid lines and border lines that make up the plot. The default is black. |
Plot background | Indicates the color in which to display the area of the plot itself. The default is white. This property is available only when No Style is selected for Quickstyle. |