Phase Diagram Overview
Phase diagrams evaluate the subsystems and components that operate in the various mission phases of a phase-based system. The phase diagram consists of the sequential phases experienced during the mission. Each phase is assigned a fixed length of duration and linked to a diagram that depicts the system operation in that phase. The mission is successful only if all phases are successful.
View Sample Phase Diagram

To create a phase diagram, you insert and define any number of phases. A newly created phase diagram contains two phases that are connected to the start and end nodes. To insert a phase, you right-click an existing phase and select Insert Phase Before or Insert Phase After. To delete a phase, you right-click the phase and select Delete. When you insert or delete a phase, connectors are inserted or deleted so that all current phases stay connected in the appropriate order.
In the Calculation Properties window for each phase, you can enter a phase description and must enter a duration in hours, which are then shown in the block representing the phase. The durations for all phases are summed to obtain the total mission time. For example, the previous figure shows a phase diagram for a system that has three phases. The total mission time for this system is the sum of the durations assigned to these three phases. Assuming the units are hours, the total mission time is 30,000 hours.
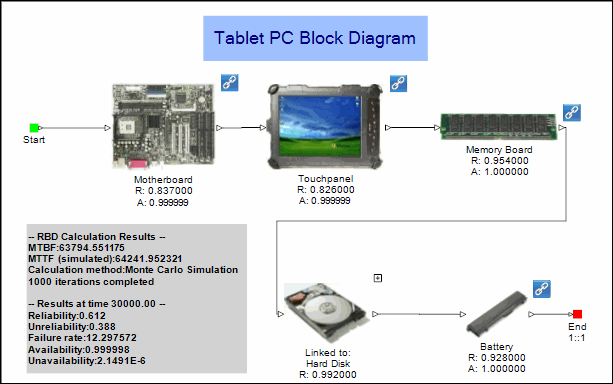
From one phase to the next, variations can occur in the system configuration, the operational requirements for individual system components, the system success criteria, and the stress on the individual system components and thus their failure rates. To account for each of these variations, you specify additional properties for the phase in its Calculation Properties window and then link it to the block diagram that indicates the logical configuration of the system components in that phase. For example, the following figure shows the block diagram that is linked to Phase 1 in the previous phase diagram.

Once a diagram link is specified in a phase’s Calculation Properties window, to go to this linked diagram, you click the diagram link (+) button that appears near the upper right corner of the phase. You can break down the blocks in the linked diagram further by linking them to other block diagrams. For example, in the above diagram, the fourth block is linked to the Hard Disk diagram. When the diagram linked to a phase depicts the configuration and properties of the subsystems operating in the phase, each subsystem diagram can link to a child diagram that defines how the various components in that subsystem operate in that particular phase.