User-Defined Derating Curves
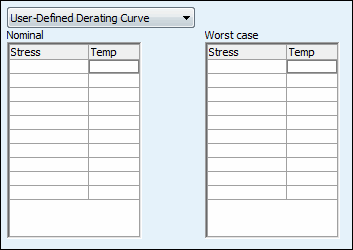
When using a user-defined derating curve for derating analysis, you enter nominal and worst case values for as many as 10 points in the Nominal and Worst case tables become available. Stress ratio values are between 0 and 1, and temperature values are entered in degrees C.

As you enter or change the values entered in these fields, the nominal and worst case curves are plotted or update in the graph that is then shown.