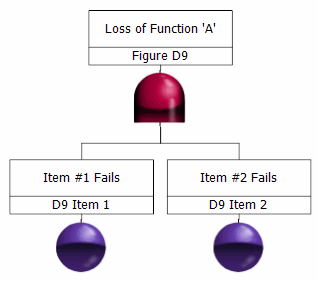
Figure D9
In SAE ARP4761, Figure D9 is an example of a fault tree where two item failures cause a loss of a function. Both of these items can fail latent.
• Item 1 and Item 2 can fail at any point between when they are checked initially and when they are next checked.
• If both Item 1 and Item 2 fail, this would be detected because these failures would cause the top event to occur.
|
|
The required failure order for these failures is built into this tree via the latency period. This is representative of a failure during the latency period before the flight.
|
In the FTA module, this two-item tree might look like the one that follows.

In the event properties for Item 1, you enter calculation data as follows:
• On the Calculation Data page:
◦ Select Failure rate/MTBF as the model.
◦ Select Failure rate and enter 1000.
◦ Select Use Approximate Formula.
• On the Latency page:
◦ Select Latent Failures.
◦ For Check Interval, enter 1000.
◦ For Failure Detection Percent, use the default value of 0.
◦ For Detection Method, select Self checking.
In the event properties for Item 2, you enter calculation data as follows:
• On the Calculation Data page:
◦ Select Failure rate/MTBF as the model.
◦ Select Failure rate and enter 2000.
◦ Select Use Approximate Formula.
• On the Latency page:
◦ Select Latent Failures.
◦ For Check Interval, enter 2000.
◦ For Failure Detection Percent, use the default value of 0.
◦ For Detection Method, select Self checking.