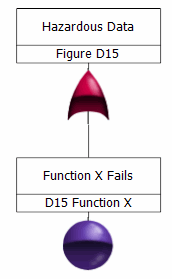
Figure D15
In SAE ARP4761, Figure D15 is an example of a fault tree where the monitor detects 90 percent of function X circuitry failures. The remaining 10 percent of function X circuitry failures is not detected until a return to service test is performed. Additionally, only 95 percent verification of monitor operation is achieved. In the FTA module, this one-event tree might look like the one that follows.

In the event properties for the one event, you enter calculation data as follows:
• On the Calculation Data page:
◦ Select Failure rate/MTBF as the model.
◦ Select Failure rate and enter 1000.
◦ Select Use Approximate Formula.
• On the Latency page:
◦ Select Latent Failures.
◦ For Check Interval, enter 1000.
◦ For Failure Detection Percent, enter 90.
◦ For Detection Method, select Monitored.
◦ For Monitor Failure Rate, enter 200.
◦ For Scrub Time, enter 1.
◦ For Scrub Verification Percent, enter 95.
◦ For Monitor Check Interval, enter 1000.