ALT Plot Legend
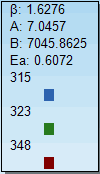
Most plots shown in the ALT Plot pane have a legend that displays distribution and life stress model parameter values and explains the color coding assigned to data points and lines for stress levels. In the figure below, 315, 323, and 348 are the temperature values for stress column 1.

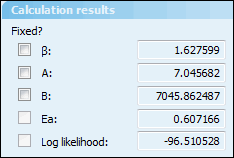
In the legend, parameter calculation results are rounded to four decimal places. However, under Calculation results in the ALT Parameters pane, parameter calculation results are rounded to six decimal places.
For example, in the legend shown above, β is 1.6276. However, in the ALT Parameters pane, β is 1.627582.

A list of the parameters for each life stress model appears in Life Stress Model Parameters. MLE (maximum likelihood estimation), an iterative solution procedure, is always used to estimate parameters for an ALT data set. MLE maximizes the likelihood and log likelihood of the distribution. Additionally, the Fisher Matrix method is always used for confidence bounds.
In the Plot Properties pane for the plot, you can use Legend location on the General page to specify the location of the legend. This pane contains many pages with properties for customizing the plot. For more information, see Plot Properties.