Graphical Attributes
Graphical attributes can be used to display a value as a graphic, rather than as text. This is especially useful for presenting business information at a glance. Graphical attributes are specially configured calculated attributes, and can be used to display persisted data such as a lifecycle state, or data resulting from simple or complex calculations.
Available graphical representations include:
|
Traffic Light
|
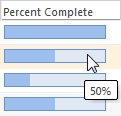
Percent Complete
|
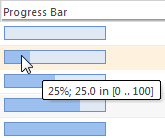
Progress Bar
|
|
Values are mapped to red, yellow, and green lights.
|
The data is displayed in a bar format, based on a range from 0 to 100, with the current value shown as a tooltip.
|
The data is displayed in a bar format, based on any specified range of values, with current value, and the beginning and end values for the progress range, and the value as a percentage shown as a tooltip.
|
|
|
|
|
|
Examples of each of the PTC-provided graphical attribute representations are available by navigating to > > . To access Customization from the Navigator, the Client Customization preference in the Preference Management utility must be set to Yes. |
To create a graphical attribute, use the steps in the following sections for the desired graphical representation:
Traffic Light,
Percent Complete, or
Progress Bar. For general instructions on creating attributes, including calculated attributes, see
Creating a New Attribute. For information on creating business algorithms to display data produced from complex calculations as a graphical representation, see
Using a BusinessAlgorithm in a Calculated Attribute.
After the graphical attribute is created, complete the following steps:
• Review the attribute layouts for the type, and ensure that the new graphical attribute is present and placed appropriately.
• Add the graphical attributes to the table views for any tables in the Windchill user interface where the new graphical attribute is desired.
• Check to ensure that the graphical representation is displaying correctly in the Windchill user interfaces which display this graphical attribute. If any error conditions are present, correct them.
Once created, graphical attributes can be added in attribute layouts and table views just as other calculated attributes can be. The tooltip value of the graphical representation is used for sorting and searching in tables.
|
|
Graphical attributes have the same behavior and limitations as other calculated attributes. For more information, see User Interface Limitations. |
Traffic Light
To define a Traffic Light graphical attribute, use the following procedure:
1. Create a new calculated attribute, with a data type of Integer.
2. Edit the calculated attribute to configure it as a graphical attribute.
a. From the Graphical Representation property, select Traffic Light.
b. In the
Formula property, specify a
formula that results in the integer 1, 2, 3, or 0, which map to the following values:
|
Result of Formula
|
Result in the User Interface
|
Tooltip
|
|
0
|
|
Red
|
|
1
|
|
Yellow
|
|
2
|
|
Green
|
|
3
|
Blank
|
|
|
|
Any value other than 1, 2, 3, or 0 results in error text similar to ???engineStatus???. Carefully construct the formula to ensure that no other values are returned.
|
3. For example, use the following formula syntax to specify that for the object, if the state is Canceled, the traffic light displays as Red, if the state is In Work, the traffic light is Yellow, if the state is Released, the traffic light is Green, and for all other states the attribute is blank:
(state.state == “CANCELLED”) ? 0 : (state.state == “INWORK”) ? 1 : (state.state == “RELEASED”) ? 2 : 3
Percent Complete
To define a Percent Complete graphical attribute, use the following procedure:
1. Create a new Calculated attribute with a data type of Integer, Real Number, or Real Number with Units, as appropriate for the value represented by this graphical attribute.
2. Edit the calculated attribute to configure it as a graphical attribute.
a. From the Graphical Representation property, select Percent Complete.
b. In the
Formula property, specify a formula which produces the percent complete value. For more information on specifying a formula for a calculated attribute, see
Calculated Attribute Formulas.
▪ For the Integer data type, the expected range of values is [0 .. 100].
▪ For the Real Number and Real Number with Units data type, the expected range of values is [0.0 .. 1.0].
For information on how values outside the range are handled, see Error Conditions.
Progress Bar
A Progress Bar graphical representation requires two pieces of input: the value representing the progress, and the range against which the progress is measured. These need to be defined using two separate calculated attributes:
• A calculated attribute for which the formula defines the beginning and ending values of the progress bar range.
• The calculated attribute for defining the graphical representation of the data.
To define a Progress Bar graphical attribute, use the following procedure:
1. Create the calculated attribute for defining the range.
a. Create a new Calculated attribute with a data type of String.
b. In the Formula property, specify the begin and end values of the range. The syntax for this formula is as follows:
bind("begin",<begin_value>)+bind("end",<end_value>)
The begin and end values can be literal values, the values of other attributes on the type, or a formula. For example, if the begin value is 0 and the end value is the value of an attribute with the internal name estimatedEffort, then specify the formula as follows:
bind("begin",0)+bind("end",estimatedEffort)
If a formula is used for the begin or end values in the formula, it must evaluate to the same data type as the attribute on which the graphical representation is defined. If an attribute or literal value is used for the begin or end values, its data type must be the same as the data type of the calculated attribute that is used to define the graphical representation (see step 2).
2. Create the calculated attribute on which the graphical representation is defined:
a. Create a new Calculated attribute with a data type of Integer, Real Number, or Real Number with Units, as appropriate for the value represented by this graphical attribute.
b. Edit the calculated attribute to configure it as a graphical attribute.
a. In the Graphical Representation property, select Progress Bar.
b. In the Graphical Representation Parameters property, specify the internal name of the calculated attribute where the range of the progress bar is specified, created in step 1.
c. In the
Formula property, specify a formula which produces the progress bar value. For more information on specifying formulas for calculated attributes, see
Calculated Attribute Formulas.
Error Conditions
After creating the graphical attribute, check its display in the user interfaces where this attribute is displayed, to ensure that it is working as expected, and correct the graphical attribute definition if needed.
• If there are errors, for example if the range for a progress bar is not correctly specified, (Unknown) is displayed in the Windchill user interface displaying the graphical attribute, and the tooltip provides more information on the error condition.
• If there is an overflow or underflow condition, where the percent complete is negative or greater than 100%, the graphical attribute representation is red, and the tooltip displays the percentage value. For example:
• If the traffic light formula evaluates to a value other than 0, 1, 2, or 3, then error text is displayed similar to the following: ???engineStatus???. Carefully construct the formula to ensure that no other values are returned.


