Including System Monitor Information when Collecting Data
If your site is using the
System Monitor, you can collect system profile and stored session information through the
System Configuration Collector in the same way you collect other data. For information about the
System Monitor, see
Using the System Monitor.
PTC includes the System Monitor Trace Plugin in the Available Plugins list. This plugin is not currently included in any of the out-of-the-box categories; you must include this plugin in a category before you can collect the related data.
The easiest way to include the plugin is to create a category for collecting System Monitor information. Additionally, you can add this plugin to any category you have created.
The following sections include:
• Descriptions of the properties you must set before you can collect data from the System Monitor server.
• An example of creating a category for collecting System Monitor data.
• Descriptions of the related fields that are presented when you collect data using the plugin.
• Descriptions of the output that is generated when you collect data using the plugin.
Prerequisites for Collecting System Monitor Data
Before you can collect System Monitor data, you must set Windchill properties to establish the access protocol, host name, and port that the System Configuration Collector can use to communicate with the System Monitor server. Use the xconfmanager utility to add the required properties to the wt.properties file that is on the Windchill server from which you are running the System Configuration Collector.
System Monitor Collection Properties
The following table contains the properties to set in wt.properties and their descriptions:
|
Property
|
Description
|
|
psm.server.protocol
|
Sets the communication protocol used when accessing the System Monitor server.
The only valid value is http.
|
|
psm.server.hostname
|
Sets the host name of the server where the System Monitor is installed.
|
|
psm.server.port
|
Sets the port number used to communicate with the System Monitor server. This port number was established when the System Monitor was installed.
When installing the System Monitor, the default port number is 8020.
|
Example of Setting System Monitor Collection Properties
To set and propagate the required properties:
1. Open a command window and start a Windchill shell.
2. Enter an xconfmanager utility command to set the values in wt.properties and propagate them.
For example, assume that the System Monitor server host name is myhost.localnet.com and the port number is the default port (8020). Then, you can enter a command similar to the following:
xconfmanager -s psm.server.protocol=http -s psm.server.hostname=myhost.localnet.com -s psm.server.port=8020 -t wt.properties -p
3. Restart the Windchill server.
Creating a System Monitor Category
To create a category for collecting
System Monitor information, follow the instructions in
Creating a Custom Collector Category. Specifically:
1. In the Name and Description fields, enter information that identifies the System Monitor category, such as System Monitor Information and Collects data from System Monitor.
2. Select the System Monitor plugin from the list of plugins in the Available Plugins table and add it to the Selected Plugins table.
Although you can add any plugins from the list to your new category, this example only describes adding the System Monitor plugin.
3. To create the new System Monitor Information category, click OK.
The result of creating this category is that a new category is added to the System Configuration Collector Categories table, for example:
Collecting System Monitor Data
To collect
System Monitor data, follow the instructions in
Collecting System Configuration Information. When selecting the categories, be sure to select the
System Monitor category that you created (or include another category in which you have added the
System Monitor plugin).
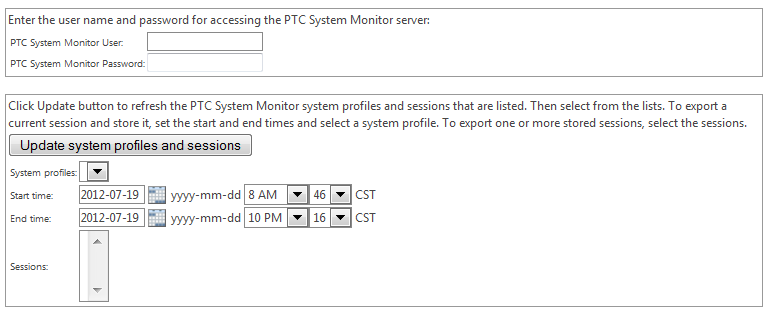
Whenever the System Monitor plugin is included in a category that is selected, the Collect System Information window includes fields in which you provide the additional information that is needed for the collecting data from the System Monitor. For example:
The information being collected is on the System Monitor server. In the PTC System Monitor User and PTC System Monitor Password fields, enter the credentials for accessing the System Monitor server. If a password is not being used, leave the PTC System Monitor Password field blank. If you do not have these credentials, you cannot collect information from the server.
After entering the credentials, click Update system profiles and sessions to populate the Update system profiles and sessions lists:
• When populated, System profiles contains a list of the system profiles that are stored on the server and accessible using the credentials provided. Use this field to have the System Monitor generate a new stored session, which is then collected:
1. Select the system profile to use.
Leaving the System profiles selection blank means that you do not want to store a new session and collect that session.
2. Specify the start and end times to identify what data to capture in the new stored session. The default times set provide a 30-minute window for the data capture. Although you can change both the start and end times, the times selected must be in the past, and the start time must be earlier than the end time.
The date, hour, and minute selections made in the Start time fields identify the earliest time for which the session data is collected. The actual time used can be later than the time selected. For example, assume you want data from an entire day and select a start time of 2012 7-19 00:00:00. However, the Windchill method server started at 2012 7-19 08:00:00. Then, the data in the session captured starts at 08:00:00.
The date, hour, and minute selections made in the End time fields identify the latest time for which the session data is collected. The actual time used can be earlier than the time selected. For example, assume you want data from entire day and select an end time of 2012 7-19 23:59:59. However the Windchill method server stopped at 2012 7-19 18:30:45. Then, the data in the captured session stops at 18:30:45.
• When populated, Sessions contains a list of the stored sessions that are on the server and accessible using the credentials provided.
You can select zero, one, or more stored sessions.
To select multiple sessions, press the CTRL key while clicking the additional sessions.
Leaving the Sessions selection blank means that you do not want to collect any of the existing stored sessions.
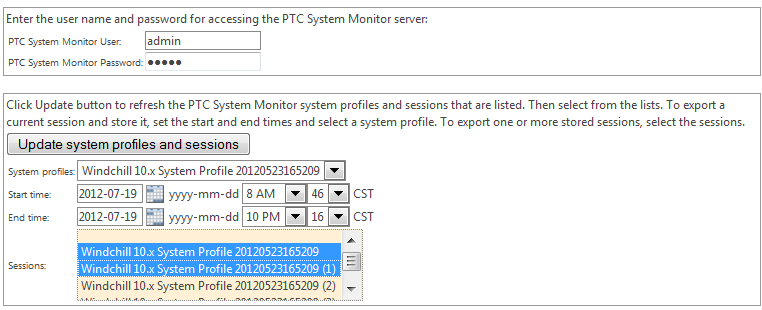
The following example shows the credentials entered, a system profile selected, and two sessions selected:
The new stored session will have data from 08:46:00 on 2012-07-19 to 22:16:00 on the same day.
Viewing Output Collected from System Monitor Plugin
When you collect data using the System Monitor plugin, the files collected are copied from the System Monitor server and stored locally under the top-level directory structure that is created in the collection process. The plugin stores the files under the Utilities subdirectory. For example, if you are collecting System Monitor session files on July 30, 2012 at 25 seconds past 2:38 PM and the collection is related to technical support call 1234567, then the files are stored in the following directory:
<top-level_path>/C1234567/Utilities/120730143825
For additional information about this directory structure, see
Collected Information Details.
If you request that a current System Monitor session be stored and then copied, the output generated includes one of the following:
• storeSessionSuccess.xml—when storing the session was successful
• storeSessionFail.xml—when storing the session failed
The stored sessions that are copied from the System Monitor server have a DTS extension. To view the data in a stored session, import the session into a System Monitor client.