Reports and Queries
A report is the output of a predefined query that is run at a particular time against a set of business information, often using parameters that are entered at the time the report is run. You can use reports for many purposes, including identifying trends, summarizing information about particular objects, identifying objects in certain states, and so on.
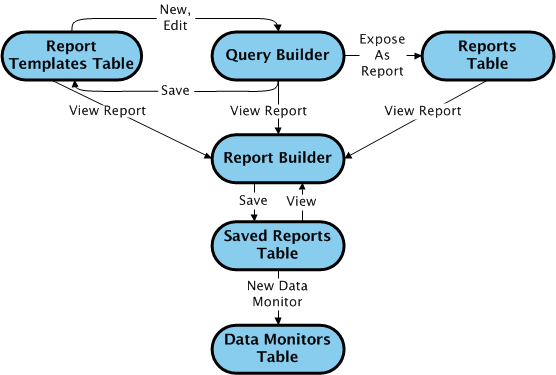
Windchill reporting is made up of a group of components, each of which performs a specific role in the life of a report. The following diagram shows the components of Windchill reporting, and the actions that connect the components:
The following sections provide more detail on each component and their relationships.
Report Templates Table
The Report Templates table lists all of the report templates present in Windchill. When you edit an existing report template (saved query), or create a new query, the Query Builder utility is launched.
The
Report Templates table is accessible to administrators only, and is launched by clicking the
Report Management link from the
Utilities page of
Site 
,
Organizations 
,
Products 
,
Libraries 
,
Projects 
, and
Programs 
. Any reports generated from the
Report Templates table are generated within the context from which the
Report Templates utility was launched. When a report template is generated from the
Report Templates table, the
Report Builder is launched.
For more information, see
Report Templates Table.
Query Builder
The Query Builder utility allows you to define and save queries against Windchill data using standard SQL concepts. A query is made up of selected attributes from selected types, joins between the types, and can include additional criteria and sub-queries. As with the Report Template table, the Query Builder utility is accessible to administrators only.
Any new queries created in the Query Builder utility are created in the context from which the Report Templates utility was originally launched. When a query is saved in the Query Builder utility, it becomes a report template and is available from the Report Templates table.
Any reports generated from the Query Builder utility are generated within the context from which the Report Templates table was originally launched. When a report is generated from the Query Builder utility, the Report Builder is launched.
When the Expose As Report property is set on a report template in the Query Builder, a report object based on the report template is made visible in the Reports table.
For more information, see
Query Builder.
Reports Table
The Reports table lists and describes all report objects available for use in the current context, including the predefined reports that were installed with your Windchill solution, and any new reports created at your site. If a report is made available in more than one context, then the report output may differ, depending on the context from which the report is viewed.
The
Reports table, along with the
Saved Reports and
Data Monitors tables, is available from multiple locations within
Windchill, including
Products ,
Projects ,
Programs ,
Changes 
,
Libraries ,
Organizations ,
Site , and
Home 
. The
Reports table in any given context is visible to all users with access to the context.
| To view the Reports table (along with the Saved Reports and Data Monitor tables) from your Home page, select Reports from the Customize menu. |
When a report is viewed from the Reports table, the Report Builder is launched.
For more information, see
Reports Table.
| If Windchill Business Reporting is enabled at your site, any reports created specifically for use with Windchill Business Reporting will launch in the Windchill Business Reporting viewer. |
Report Builder
The Report Builder provides a means for users to filter the specified criteria for a Windchill report, and enter input parameters as needed. When the report is generated, the report output is displayed in the Results Table, from which the output can be exported in various formats. If the report output in the Results Table is not as expected, the criteria can be changed in the Criteria pane and the report regenerated as needed, all within the same session of the Report Builder window. Charts can be created to graphically display the report output above the Results Table.
Specified report criteria can be saved by site and organization administrators for later re-use. Such saved criteria is available from the Saved Reports drop-down list in the Criteria pane of the Report Builder when viewing the report for which it was saved, as well as from the Saved Reports table.
For more information, see
About the Report Builder.
Saved Reports Table
The Saved Reports table lists all saved criteria for the reports available in the Reports table for the current context. For any individual report, multiple saved reports can be created. The Saved Reports table always displays along with the Reports and Data Monitors tables in any given context, and is visible to all users with access to the context.
When a saved report is viewed from the Saved Reports table, the Report Builder is launched.
For each saved report, multiple data monitors can be created, which display in the Data Monitors table.
For more information, see
About Saved Reports.
Data Monitors Table
The Data Monitors table lists all data monitor objects created from the saved reports in the Saved Reports table.
A data monitor is a scheduled execution of a saved report that sends an email notification when a specified threshold of results (typically 1) is met. Executed reports are persisted in the database and can be viewed at any time after their execution, until they are purged.
Data monitors can be useful for automating reports that must be run on a regular basis and distributing the output to the necessary individuals. Data monitors are also useful as alerts, especially when used with a threshold value. Multiple data monitors can be created for a single saved report, for different purposes.
The Data Monitors table always displays along with the Reports and Saved Reports tables in any given context, and is visible to all users with access to the context.
For more information, see
About Data Monitors.