Using the Sample Anomaly Dashboard Mashup
When multiple anomaly alerts are active, a mashup is a good way to view the different streams of data. You can build your own mashup using the Mashup Builder in ThingWorx Composer, but for convenience, a sample Anomaly Dashboard mashup is available for import. To access and use the sample mashup:
3. In ThingWorx Composer, navigate to > .
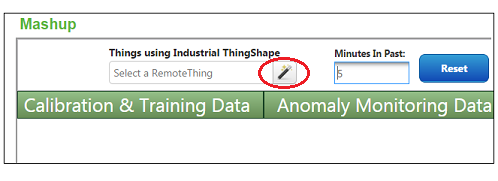
4. Select the Anomaly_Dashboard mashup. The dashboard mashup opens but does not display any data yet..
5. Click the entity picker icon

and select a remote Thing where an anomaly alert has been enabled.
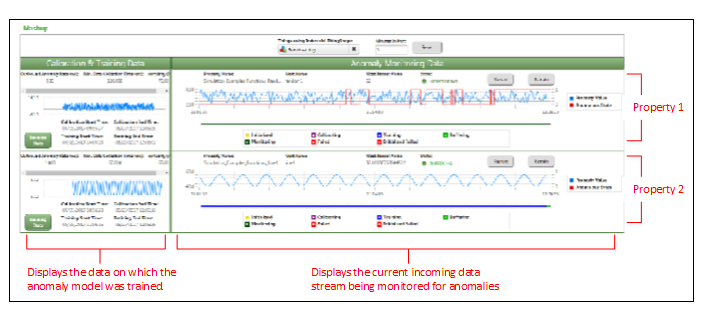
A row of data will be displayed for each property that has an active anomaly alert on the remote Thing. In the example below, two properties are displayed. Each row of data includes current anomaly monitoring data on the right and historical calibration and training data on the left.
| The left panel showing the Calibrating and Training data will be useful when the anomaly alert reaches Buffering or Monitoring status and the data used to train the model is no longer in view on the right side. You can also click Training Stats to open a panel with more detailed training information. |
The following video demonstrates the use of the Anomaly Dashboard mashup.
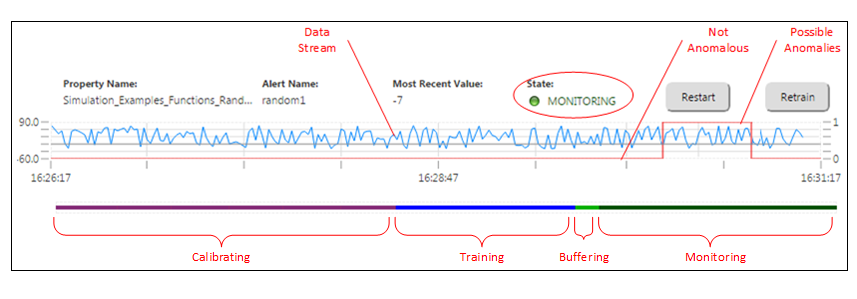
For a more detailed view of the information included on each property row, see the image below. It includes the following information:
• Graph — The blue line shows the incoming data values. The red line indicates whether those values are not anomalous or possibly anomalous.
• Color-coded status bar — Show the status of the anomaly alert at specific points.
• Alert parameters — Shows information about the alert, including the name of the property being monitored and the current status of the alert.
| The State value should match the status color on the far right side of the color-coded status bar. |
• Restart — Launches the RestartThing service of the remote Thing where the property being monitored is located.
• Retrain — Launches the RetrainAlert service of the remote Thing. This action sets the anomaly alert back to the Calibrating status where it begins recollecting data to build a new model and generate new validation data.