Downtime
Downtime Events can be viewed, filtered, modified, or added from the Operator Dashboard.
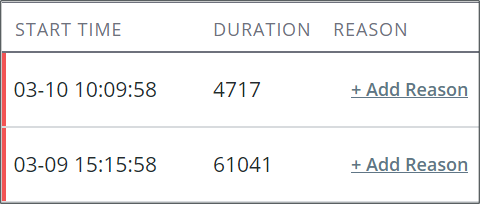
Downtime Event List
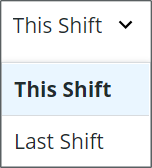
The downtime Event list will display all downtime events for the selected Equipment for either This Shift or Last Shift. Use the shift drop-down to switch between viewing downtimes for This Shift and Last Shift.
The list can also be filtered based on whether the downtime event has a reason. Toggle the Show Only Missing Reasons toggle to filter the list.
For downtime events that are missing a reason, click Add Reason in the Reason column to select the reason for the downtime event.
The Downtime History button can be used to open the full Downtime display in a new browser tab. The Equipment and Time Frame will be automatically filled based on operator dashboard selections.
Adding a Downtime Event
1. Click New Downtime. The Add New Downtime window popup will display with the equipment automatically set to match the operator dashboard equipment selection.
2. Enter a Duration length if the End Time of the downtime event should be the current time. The Start Time will be the End Time minus the Duration.
3. OR enter a Start Time and End Time manually.
End Time should be left blank if the Downtime Event is ongoing. |
4. Click Save to create the event.
5. Click Next to move to the Reasons tab.
Reason is optional. Click Next if there is no associated reason. |
6. Select the top-tier reason from the selection automatically populated.
a. If the reason selected has another tier they will auto-populate
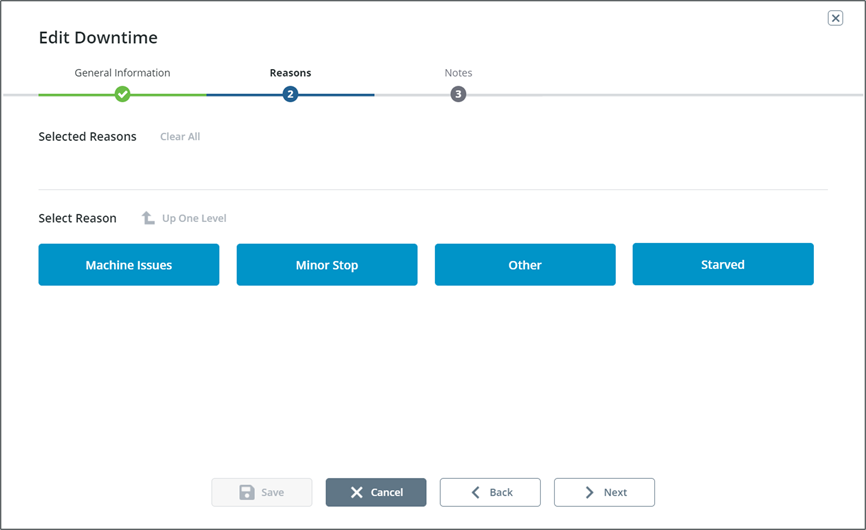
7. Selected reasons will display above as breadcrumbs displaying each tier.

8. Once the reason has been set appropriately click Next to move to the Notes tab.
9. Enter any relevant notes (optional) and click Add.
10. Click Save and Close to return to the Operator Display.