Operator Dashboard Contents
Shift OEE
The shift OEE pane displays the overall equipment effectiveness (OEE) KPI information for the equipment for the current shift, which includes availability, performance, and quality percentages.
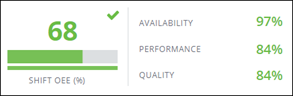
The Shift OEE KPI panel refreshes every minute if there is an event change that affects KPI (downtime, job order, product change). The data will automatically update every 5 minutes. |
Active Work Order or Product
If the RTPPM system uses work orders, this pane shows information on the active work order, including the number of the active work order, the active product, the planned start and end time, and how many of the planned number of units to be produced for this work order have been completed. This information typically comes from an external ERP system.

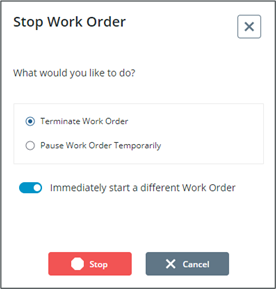
Click Stop to open the Stop Work Order pane. From this pane the current work order can either be permanently terminated or temporarily paused. Paused work order can also be reopened.
Click Stop to perform the selected action.
When the Immediately start a different Work Order toggle is turned on and Stop is clicked, the Start Work Order window opens to select the next work order to start.
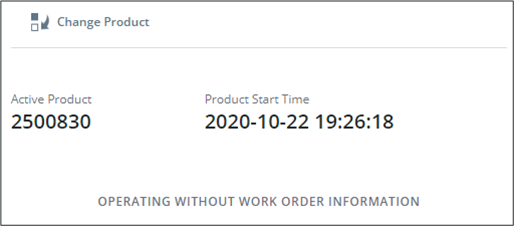
If the RTPPM system does not use work orders, the pane shows the active product currently being produced by the equipment, and the time at which work on that product began.
Click Change Product to select a different active product.
Operating Mode
The operating mode pane indicates whether the dashboard is in automatic or manual operating mode.
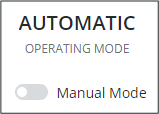
In automatic operating mode, downtime and waste events are automatically registered by the system; however, the operator can make manual entries and updates.
In manual operating mode, all production and waste events are entered manually by the operator.
No IoT data will be collected when in manual operating mode. |
Use the Manual Mode toggle to switch between the operating modes.
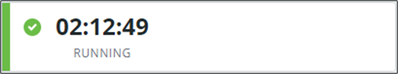
Status and Downtime Events
The status pane displays the current equipment status, how long the equipment has been in that status, and the reason if the status is down. The  button will display for open downtime events and allows the user to edit all information regarding the event.
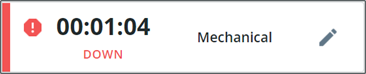
Open downtime events that have not been assigned a reason will have the Add Reason button displayed in place of the allowing users to navigate directly to the Reason tab of the Edit Downtime Event popup.