Viewing Trends
Summarized Attribute Trend Data
When attribute data has more data points than can display on the screen, the trend will show as a trend summary.
The time range is divided into even time periods, and the first, last, minimum, and maximum values for the period are used to draw the trend summary.
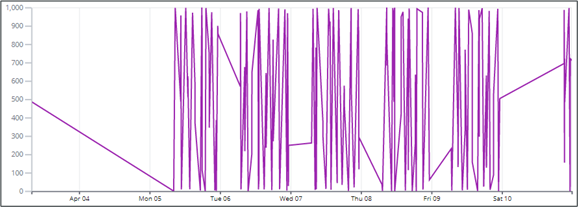
A shorter time frame can be selected , or zooming in on the chart, will show actual data points.
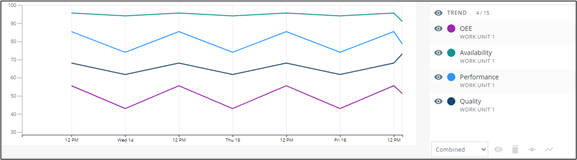
KPIs
KPI trends use data from Real-Time Production Performance Management (RTPPM). The KPIs are calculated for time periods based on the selected time frame. For example, when viewing KPI data for a month, it is possible to see a data point for each day.
Trend Tooltips
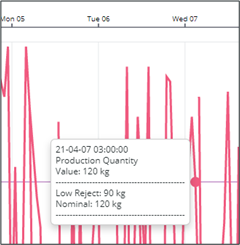
A tooltip will show detailed information for a trend on mouse over. The information shown will vary based on the trend type.
• Attributes – Timestamp, attribute name, value, unit of measure, and any limits that are shown.
• KPIs – Timestamp, KPI name, value in percent, and any limits that are shown
Limits
Control characteristic limits can be hidden or shown from the legend. See Data Tools / Limits Visibility.