Trends
General
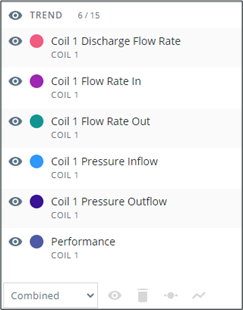
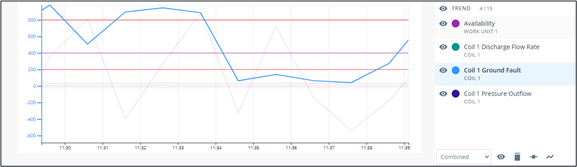
Trends include attributes and KPIs and are listed in the bottom section of the legend panel. The color label corresponds with the color shown in the trend section of the chart.
The legend tools allows users to interact with the chart in real time.
Select, show/hide, alias, change color, change line mode, and remove trends via the legend.
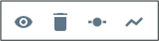
The bottom toolbar is disabled until one or more trends are selected. The toolbar allows you to interact with multiple trends at once.
Selection
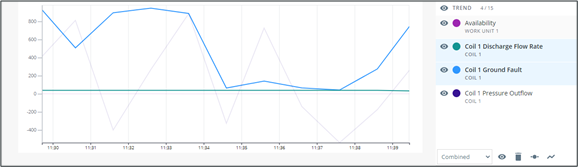
Clicking one or more trends in the legend will select them. The trend will be highlighted in the chart at full opacity, while other trends will lower opacity.
When a single trend is selected, the y-axis will:
• Be labelled with numbers, even in auto-scale mode
• Change color to match the trend
Show/Hide
Hide a trend by clicking  next to the item in the legend. It will then be disabled from the legend and disappear from the chart trends.
Show a hidden trend by clicking  .
.
Select multiple trends and bulk hide or show them by clicking in the bottom toolbar. The bottom toolbar is disabled when there is no item selected.
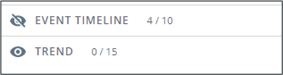
Hide the entire trend section by clicking in the header. Clicking again will toggle visibility back on. The two sections cannot be hidden at the same time.
Color Configuration
Mouse over a trend in the legend, and then mouse over  to access more tools in a dropdown menu.
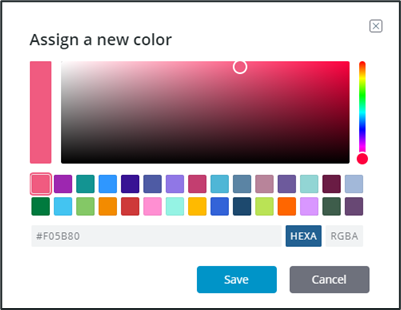
Click Color to launch the assign color popup.
Select a color by:
• Using the color picker tools
• Clicking one of the 30 pre-assigned color swatches
• Manually entering the HEXA or RGBA color code in the textbox.
Click Save. Or, click Cancel to abandon the change.
Alias
Rename a trend from the tools submenu. Click Edit to launch the edit trend alias popup.
Remove
remove a trend from the chart completely by clicking Remove from the tools submenu.
Bulk remove trends by selecting multiple and clicking  in the bottom toolbar.
The bottom toolbar is disabled when there is no item selected.
Limits Visibility
Control characteristic limits can be drawn on the trend chart to identify data points out of threshold.
Enable limits for a trend from the tools submenu.
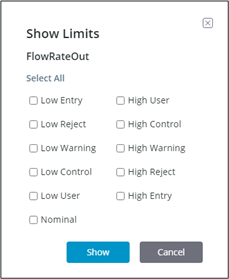
1. Click Show Limits to launch the limits selection popup.
2. Check any or all of the boxes to select the limit, or click Select All to show all.
3. Uuncheck all limits with Clear All.
4. Click Show to show these limits on the trend chart, or, click Cancel to close the popup without change to the chart.
Only limits configured in the system will be drawn on the trend chart.
Limits are shown semi-transparent for non-selected trends. When a trend is selected in the legend and highlighted on the chart, the limits will also appear opaque.
Limits will be shown in specific colors.
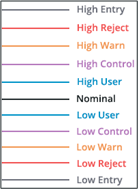
Limit values will also be shown in the trend chart tooltip when hovering on a trend.
Draw Modes
Trends are rendered on the chart in one of three styles: Default Mode, State Mode and Dots Only. You can toggle between the various modes and the trend will redraw accordingly.
• Default Mode  - Data points are linked together via a direct line.
• State Mode  - Data changes are shown as a step, with a flat horizontal line until the next data point is reached.
• Dots Only  - Only dots are shown for each data point.
Dots Modes
In addition to draw mode, you can toggle the visibility of the dots on  / off
/ off  , except when draw mode is set to dots only. In this case, dots are always shown and cannot be toggled.
Y-Axis Modes
Set the chart y-axis mode to Combined or Auto Scale by clicking the dropdown in the footer of the legend.
Combined mode takes the trend data overall minimum and maximum to set the y-axis range. The chart’s y-axis labelling is always shown in gray.
Auto Scale mode will render trends to always take up the available room on the chart. The y-axis labelling is hidden until you select a single trend. When shown, the y-axis labelling will be specific to the selected trend and will use the same color.