KPIs
Key Performance Indicators (KPIs) include the metrics calculated by the Real-Time Production Performance Monitoring (RTPPM) application. They will be shown in the Charts view as a time series trend.
|
|
If RTPPM is not deployed, KPIs will not appear as a data source.
|
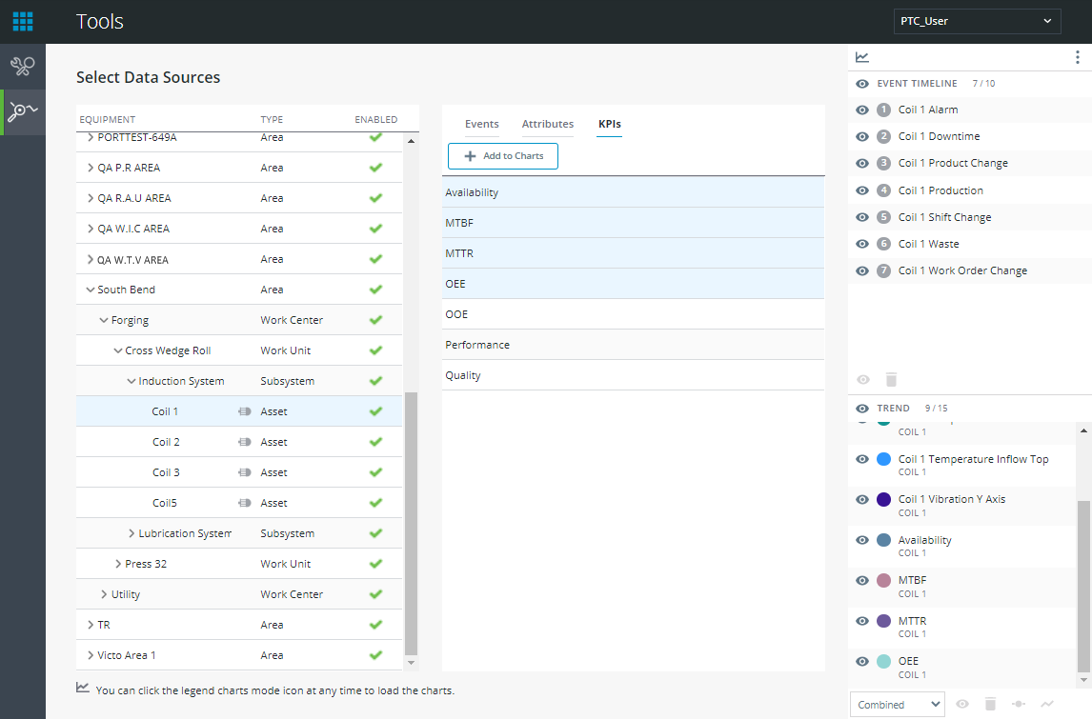
1. From the Select Data Sources display, locate and select the desired equipment.
2. In the middle panel, on the KPIs tab, select the KPIs to analyze. Shift and Control can be used to multi-select.
3. Click Add to Charts. The selected events will appear in the lower section of the legend panel to the right.
|
|
Up to 15 combined attributes and KPIs can be added to the chart. If the selected items cannot be added, a message will be displayed.
|